

Growth marketing is a dynamic and ever-evolving field that has emerged as a by-product of the digital age. It is characterized by its experimental, agile, and iterative approach, sometimes wrongly referred to as “growth hacking.” However, there is a misconception that growth marketing is all about taking shortcuts or quick wins. In reality, the most successful growth marketing efforts are data-driven and rely on growth marketing key metrics to establish a baseline, track progress, identify what’s working, and scale the business.
The importance of growth marketing metrics cannot be overstated. These metrics are essential for measuring business performance, specifically in the areas of revenue, acquisition, and retention. Depending on your company’s growth goals, different metrics may take priority. However, what is non-negotiable is having access to accurate data. As businesses add more apps, tools, and platforms to their tech stacks, they can run into issues with siloed data. Having a scalable data infrastructure to consolidate customer data in real time and democratize it across the organization is crucial for monitoring and optimizing growth metrics effectively.
We’ll take a closer look at the key growth marketing metrics that every business should be tracking. By understanding these metrics and why they matter, you’ll be better equipped to optimize your growth marketing strategies and achieve sustainable growth for your business.
Understand how your prospects behave (in real time)
- Visualize how visitors move across your website
- Identify drop-offs and friction points instantly
- Turn journey data into actionable insights with AI

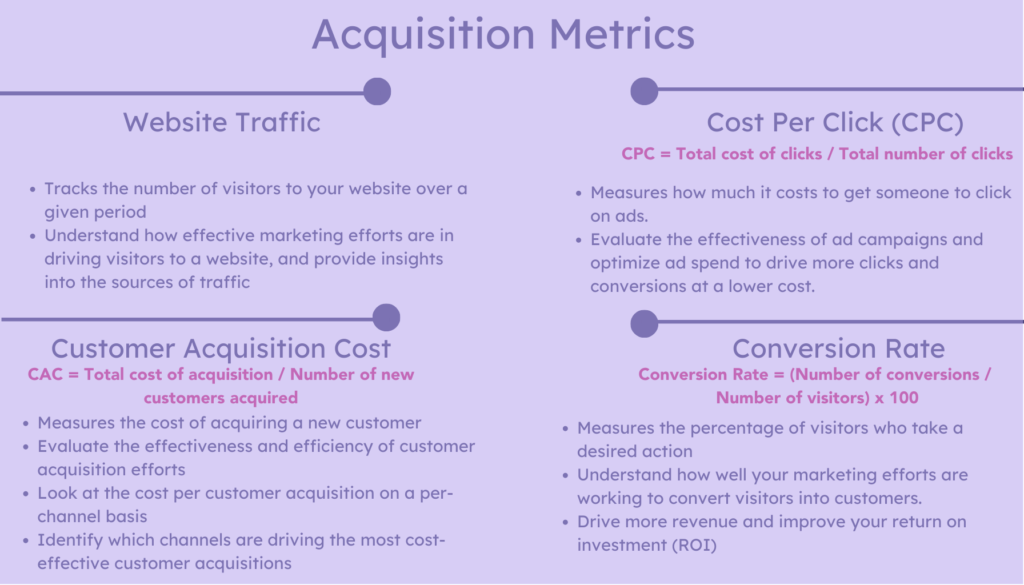
Acquisition Metrics: Website Traffic, CPC, CAC, Conversion Rate
Acquisition metrics refer to the set of growth marketing key metrics that measure the effectiveness of your marketing campaigns in attracting and converting new customers. They provide insights into how well your marketing efforts are performing at each stage of the customer acquisition funnel. By tracking acquisition metrics, you can optimize your marketing strategies to drive more traffic to your website, increase engagement, and ultimately boost conversions.
1. Website Traffic
Website traffic is one of the most basic and essential acquisition metrics. It tracks the number of visitors to your website over a given period. Tracking your website traffic can help you understand how effective your marketing efforts are in driving visitors to your site. Additionally, it can also provide insights into the sources of your traffic, such as organic search, social media, or referral traffic.
2. Cost Per Click (CPC)
Cost per click (CPC) is a metric that measures how much it costs to get someone to click on one of your ads. This metric is particularly useful for paid advertising campaigns, such as Google AdWords or Facebook Ads. By tracking CPC, you can evaluate the effectiveness of your ad campaigns and optimize your ad spend to drive more clicks and conversions at a lower cost.
CPC = Total cost of clicks / Total number of clicks
3. Customer Acquisition Cost (CAC)
Customer acquisition cost (CAC) measures the cost of acquiring a new customer. It includes all of the expenses associated with acquiring a customer, such as marketing and advertising costs, sales commissions, and salaries for employees involved in the acquisition process. By tracking CAC, you can evaluate the effectiveness and efficiency of your customer acquisition efforts. A low CAC is an indicator of a healthy acquisition process, whereas a high CAC may suggest that your acquisition strategies need improvement.
CAC = Total cost of acquisition / Number of new customers acquired
When tracking customer acquisition cost (CAC), it’s important to look at the cost per customer acquisition on a per-channel basis. This means analyzing the cost of acquiring customers through different marketing channels such as paid search, social media, email marketing, etc.
By tracking CAC per channel, you can identify which channels are driving the most cost-effective customer acquisitions and allocate your marketing budget accordingly.
4. Conversion Rate
Conversion rate is a growth marketing key metric that is critical to acquisition. It measures the percentage of visitors to your site who take a desired action, such as filling out a form, making a purchase, or subscribing to a newsletter. Tracking conversion rates can help you understand how well your marketing efforts are working to convert visitors into customers. By optimizing your conversion rate, you can drive more revenue and improve your return on investment (ROI).
Conversion Rate = (Number of conversions / Number of visitors) x 100
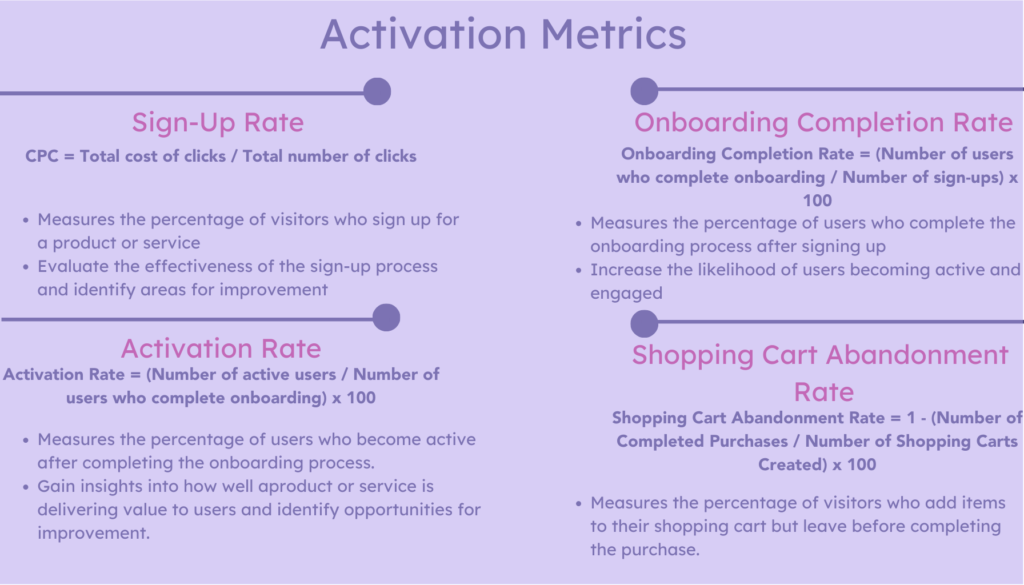
Activation Metrics: Sign-up Rate, Onboarding Completion Rate, Activation Rate, Shopping Cart Abandonment Rate
Activation metrics are the set of growth marketing key metrics that measure the effectiveness of your onboarding process in converting sign-ups into active users. These metrics provide insights into how well you are engaging with your users and delivering value to them. By tracking activation metrics, you can optimize your onboarding process to increase user engagement, retention, and revenue.
1. Sign-Up Rate
The sign-up rate measures the percentage of visitors who sign up for your product or service. This metric is particularly relevant for businesses that offer a free trial or freemium model. Tracking sign-up rates can help you evaluate the effectiveness of your sign-up process and identify areas for improvement.
Sign-up Rate: (Number of sign-ups / Total number of visitors) x 100
2. Onboarding Completion Rate
The onboarding completion rate measures the percentage of users who complete the onboarding process after signing up. This metric is critical for understanding how well your onboarding process is working, how well you introduce users to your product or service, and how you help them get started. By optimizing your onboarding process, you can increase the likelihood of users becoming active and engaged.
Onboarding Completion Rate = (Number of users who complete onboarding / Number of sign-ups) x 100
3. Activation Rate
The activation rate measures the percentage of users who become active after completing the onboarding process. This metric is the most critical activation metric since it directly measures the effectiveness of your onboarding process in converting sign-ups into active users. By tracking the activation rate, you can gain insights into how well your product or service is delivering value to users and identify opportunities for improvement.
Activation Rate = (Number of active users / Number of users who complete onboarding) x 100
4. Shopping Cart Abandonment Rate
The shopping cart abandonment rate measures the percentage of visitors who add items to their shopping cart but leave before completing the purchase. This metric is particularly relevant for e-commerce businesses.
Shopping Cart Abandonment Rate = 1 – (Number of Completed Purchases / Number of Shopping Carts Created) x 100
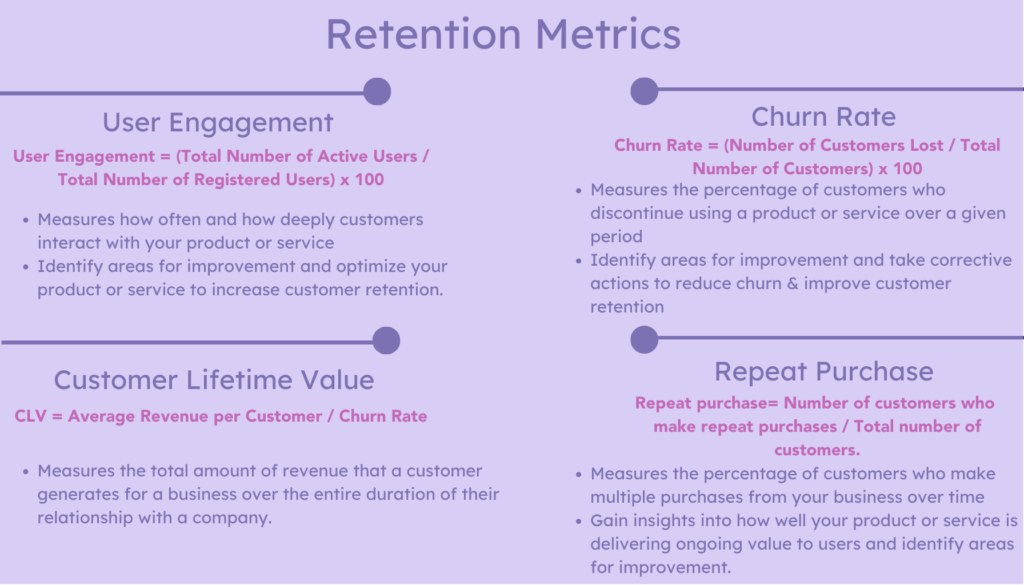
Retention Metrics: User Engagement, Churn Rate, CLV, Repeat Purchase
Retention metrics are the set of growth marketing key metrics that measure the ability of your product or service to retain customers over time. These metrics provide insights into how well you are engaging with your customers, delivering value, and building loyalty. By tracking retention metrics, you can identify opportunities to improve customer retention, reduce churn, and increase revenue.
1. User Engagement
User engagement measures how often and how deeply customers interact with your product or service. This metric is critical for understanding how well your product or service is delivering value to customers and whether they are likely to continue using it over time. By tracking user engagement, you can identify areas for improvement and optimize your product or service to increase customer retention.
User Engagement = (Total Number of Active Users / Total Number of Registered Users) x 100
2. Churn Rate
The churn rate measures the percentage of customers who discontinue using your product or service over a given period. This metric is critical for understanding how well your product or service is meeting customer needs and whether you are delivering value. By tracking the churn rate, you can identify areas for improvement and take corrective actions to reduce churn and improve customer retention.
Churn Rate = (Number of Customers Lost / Total Number of Customers) x 100
3. Customer Lifetime Value (CLV)
Customer lifetime value measures the total amount of revenue that a customer generates for your business over the entire duration of their relationship with your company. This metric is critical for understanding the long-term value of your customer base and identifying opportunities to increase customer retention and revenue.
CLV = Average Revenue per Customer / Churn Rate
4. Repeat Purchase
Repeat purchase measures the percentage of customers who make multiple purchases from your business over time. This metric is a leading indicator of customer loyalty and satisfaction. By tracking repeat purchases, you can gain insights into how well your product or service is delivering ongoing value to users and identify areas for improvement.
Repeat purchase = Number of customers who make repeat purchases / Total number of customers.
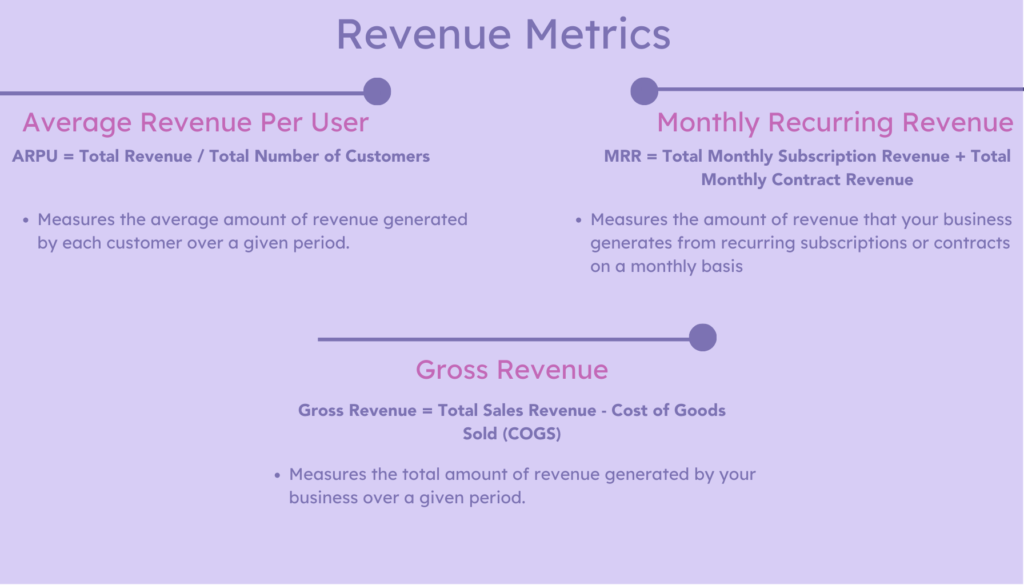
Revenue Metrics: ARPU, MRR, Gross Revenue
Revenue metrics are the set of growth marketing key metrics that measure the financial performance of your business. These metrics provide insights into how well you are generating revenue and driving growth. By tracking revenue metrics, you can identify opportunities to increase revenue, optimize pricing, and improve profitability.
1. Average Revenue Per User (ARPU)
ARPU measures the average amount of revenue generated by each customer over a given period. This metric is critical for understanding the value of your customer base and identifying opportunities to increase revenue.
ARPU = Total Revenue / Total Number of Customers
2. Monthly Recurring Revenue (MRR)
MRR measures the amount of revenue that your business generates from recurring subscriptions or contracts on a monthly basis. This metric is critical for understanding the stability and predictability of your revenue streams.
MRR = Total Monthly Subscription Revenue + Total Monthly Contract Revenue
3. Gross Revenue
Gross revenue measures the total amount of revenue generated by your business over a given period. This metric is critical for understanding the overall financial performance of your business and identifying opportunities to increase revenue.
Gross Revenue = Total Sales Revenue – Cost of Goods Sold (COGS)
Referral Metrics: NPS, Referral Rate
Referral metrics measure how effectively your business is leveraging word-of-mouth marketing to acquire new customers. These metrics provide insights into how satisfied your customers are with your product or service and how likely they are to refer others to your business. By tracking referral metrics, you can identify opportunities to increase customer satisfaction, improve your product or service, and drive growth through word-of-mouth marketing.
1. Net Promoter Score (NPS)
NPS measures how likely your customers are to recommend your product or service to others on a scale of 0-10. This metric is critical for understanding customer satisfaction and identifying opportunities to improve your product or service.
NPS = % Promoters – % Detractors
2. Referral Rate
The referral rate measures the percentage of new customers that come from referrals. This metric is critical for understanding the effectiveness of your word-of-mouth marketing efforts and identifying opportunities to increase referrals.
Referral Rate = (Number of New Customers from Referrals / Total Number of New Customers) x 100
Smart Data, Smart Marketing: Find Your North Star Metric
While all the metrics discussed so far are essential for measuring and improving the performance of your marketing efforts, it’s crucial to identify your North Star Metric. Your North Star Metric is the single metric that best captures the core value that your product or service delivers to your customers. It’s the one metric that, when it grows, drives the growth of your business as a whole.
To find your North Star Metric, you need to ask yourself what is the key value proposition that your product or service offers to your customers. What is the one thing that, if you could increase or improve, would lead to greater customer satisfaction and growth for your business?
Once you have identified your North Star Metric, you can focus on efficient data analysis in order to optimize and improve your efforts. By doing so, you’ll have a better understanding of what drives growth for your business and can prioritize your resources and efforts accordingly.
Understand how your prospects behave (in real time)
- Visualize how visitors move across your website
- Identify drop-offs and friction points instantly
- Turn journey data into actionable insights with AI
Conclusion
Without these growth marketing key metrics, growth-oriented marketers cannot determine whether their marketing efforts are working, whether their customers are happy, or whether their business is growing. By tracking and analyzing the right acquisition, activation, retention, revenue, and referral metrics, you can gain insights into how your business is performing and identify areas for improvement.
To truly make the most of your metrics, it’s important to identify your North Star Metric, which is the one metric that matters most to your business. By focusing on your North Star Metric, you can align your team around a common goal and make data-driven decisions that drive growth.