The goal of Pathmonk Intelligence is to analyze the growth opportunities and buying journey on your website in order to generate suggestions on how to improve and get better results.
The truth is, it’s often hard to tell why your site doesn’t bring the expected results and how to change that. Pathmonk Metrics highlights what requires your attention and gives actionable suggestions for better results.
In This Article
Pathmonk Intelligence immediately tells you what you need to know and how to fix it rather than just presenting you with raw data.
Today, we want to look at the different insights that you get from standard website analytics tools, such as Google Analytics, heatmaps, and session recording tools, like Hotjar and how these compare to Pathmonk Metrics.
Why Should I Have a Different Perspective on Website Conversions?
The concept of website conversions can be rather abstract. At a first glance, it is just a percentage that measures how many of your website visitors complete the goal that your marketing team is working hard to achieve, such as, demo requests, click-to-calls, lead form completions, etc.
However, more than 98% of all website visitors simply leave the website without completing that goal. So the vast majority of traffic that is generated through either paid or organic sources simply abandon your page.
So the question arises: WHY is this happening in the first place and WHAT can I do about it that effectively impacts this situation?
To understand, and increase website lead generation, it’s wise to start at a place that many lead gen marketers overlook: understanding your visitor’s buying journey, we don’t just mean the pages that they visit, but rather the pages they look at and interactive with.
- What initially drives them to your site?
- Do they understand what problem you are solving?
- Can they resonate with that problem?
- Do they see a unique solution in your solution?
- Do they perceive enough value?
- …and is there anything that triggers them to act once they start considering?
So let’s have a different perspective: Instead of focusing on the final outcome, the conversion rate itself, which can be daunting to tackle, focus on what happens before, the buying journey stages that visitors experience on your website.
Why is Buying Journey Analysis a Key for More Website Qualified Leads?
Think about the changes that you did to your website in the recent weeks and months…
Often it’s single improvements, sometimes driven by A/B testing, that may result in a temporary uplift in your conversion rates. However, if you want to improve lead generation from your website in a significant and sustainable way, you need to look at the big picture: the full Buying Journey that visitors experience on your site.
This is especially relevant if you are selling something that requires some in-person explanation, new software, or specialized service. Any service or product that has a decision journey involved and buyers evaluate the options with care before even getting in touch, then understanding their whole journey can contribute to increased conversions.
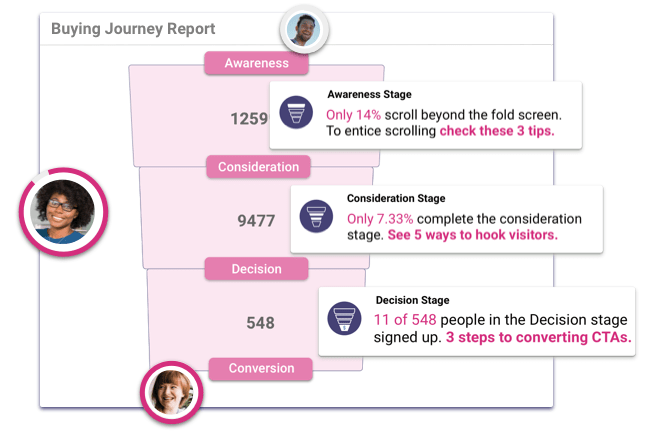
The Buying Journey is the process that buyers go through to become aware of, consider, and decide to purchase your product or service:
- Stage 1 The Awareness stage: After a buyer realizes they have a problem or pain point they are eager to find a solution and begin discovering their options.
- Stage 2 The Consideration stage: Buyers have defined their goal and are committed to addressing it. They evaluate the specific offering and start to become willing to engage with businesses.
- Stage 3 Decision Stage: Buyers have already decided on a solution category. They have a profound understanding of specific offerings and need to decide on the one that best meets their needs.
Buyers can gain nearly all the information they need independently on your site and through other online sources. So it’s no surprise that almost 70% of buyers’ journeys are done independently online and potential buyers have already completed 67% of their decision-making process before they talk to someone from your team.
So now think about the following:
Many of your visitors will be in the Awareness stage. They just got to know you…hand to heart.. how likely is it that they now click your “Get Demo” Button? At this stage…are you serving them information that offers clarity in the problem you are solving. Is the information appropriate to their stage in the journey as they might not yet fully comprehend what problem you are solving.
Alternatively, what if a smaller group of visitors make it to the decision stage – Are you sure they have seen your case studies and testimonials that prove results?
The gist is: If you are collecting leads, demos, etc. in any shape or form on your website, the Buying Journey stages are what visitors will go through – some quicker than others. If you want to improve website lead generation and know why people are not converting tackle the challenge from a new angle: Look at the buying journey stages and improve each stage one by one.
What Do Other Tools Tell Me About Why People Don’t Convert?
Website Analytics Tools (like Google Analytics or Oribi)
Google Analytics is the most popular website analytics tool, with 85% of all websites using it. Essentially, it helps you to collect, analyze, and report on your website traffic. It tracks pretty much everything on your website. Actually more than +100 metrics.
Despite the fact that many marketers pretty much ignore the majority of the reports that Google Analytics offers, there is an important distinction. Google Analytics doesn’t tell you why visitors don’t convert. Your concerns are not answered
- Why do people bounce from your pages?
- In which stage of the Buying Journey do people get stuck?
- Why do those that start to seriously consider your offer still leave?
- How many of your visitors seriously consider your offer?
So after digging through endless piles of website data two questions will still remain: Why do people not convert and more importantly what should I do about it?
User behavior tools ( like Hotjar, CrazyEgg, Mouseflow, LuckyOrange)
In search for the “why people don’t convert” other types of techniques often come into play – heatmaps & session recording in particular. 8% of all websites use heat maps and session recording tools mentioned above. They are great pieces of technology.
Heat Maps
Heat Mapping tools are popular among marketers because they offer an easy way to visualize complex behavioral website data.
The interaction spots you find on heatmaps represent the aggregated user experiences on your site.
- You can get an understanding of how people interact with specific pages by showcasing ‘hot’ and ‘cold’ interaction spots
- You can see where the mouse moves, how far they scroll where they try to click
Often marketers look at heatmaps and feel pretty convinced that they are getting to a deeper understanding of their visitors. We don’t want to go into the underlying challenges of heatmap data in this post (you can actually read more on that here) but unfortunately, it’s easy to get fooled by a heat map.
The heatmap visualization itself doesn’t directly tell you what you probably want to know. Heat maps are notoriously hard to convert into actionable insights. It can be challenging to translate from visualization into a specific action. The unfortunate reality in many scenarios is that heatmap visualization often becomes a distraction rather than a solution.
Session recordings
A great way to discover UX issues on your website is to watch video recordings of your users interacting with the page. The recordings reconstruct your users’ journey across the website:
- You can see how users move around and navigate your site
- You can see how they interact with your site from page to page
- You can uncover UX issues or bugs on your site
These tools can record thousands of sessions, often far too many to manage. Typically the challenge is to actually watch them. Therefore, most marketers we meet lack the time and don’t watch most of the recordings.
After more than 400+ conversations with B2B marketers, we came to the conclusion that session recordings are a great way to identify specific UX issues, broken links, hidden buttons, etc, but they don’t tell you Why users don’t progress in their Buying Journey. It’s a great way to fix pointed issues but not ideal to solve gaps in the overall journey.
This is How Pathmonk Intelligence Knows Why People Don’t Convert
Pathmonk Intelligence focuses on your website Buying Journey. We provide data that is impossible to get for Lead Gen Marketers with Google Analytics or Heatmaps.
Why?
Because Pathmonk analyses each step that website visitors take in their buying journey (every click, every scroll, every tab change, every revisit, etc,) This tool knows where people are in the Buying Journey and how far they are from making a decision, all thanks to Pathmonk’s AI.
Without having to set up any trigger events, reading into heatmap results, or watching countless user session videos, it tells you what you need to know to improve the Buying Journey on your website. It literally provides hands-on suggestions that tackle the specific bottlenecks on your website.
When you know why you’re losing leads and you know what you can do to tackle those challenges then you can improve the buying journey on your website. With Pathmonk Intelligence, you get all the buying journey data and actionable change suggestions at a glance so you can focus on creating a better Buying Journey for your visitors.
As you read this, Pathmonk’s AI is already learning from countless lead gen pages. SO once you plug it into your page you will immediately benefit from the AI suggestions without having to crunch numbers for countless hours to get to insights.
Know Why Your Page Is Missing Results
Pathmonk Intelligence analyses the growth opportunities & user journey on your website, then generates suggestions on how to improve.