GLOSSARY
Average Order Value (AOV)
Average Order Value (AOV) is the average amount of revenue generated per transaction over a defined period. It is calculated by dividing total revenue by the number of orders and is used to understand customer spending behavior and to guide pricing, merchandising, and marketing decisions.
Average Order Value, or AOV, captures how much customers spend each time they complete a purchase or lead-conversion event. For e-commerce sites, it reflects the dollar value of cart checkouts; for lead-gen models that monetize via form completions or downstream transactions, it can be adapted to revenue per qualified conversion. AOV is a behavioral metric that sits alongside conversion rate and traffic volume to determine overall revenue performance.
Because AOV is an average, it smooths over variability: a few large orders can inflate it while many small orders depress it. That makes segmenting by cohort, traffic source, product, or campaign essential to get actionable insights. Segment-level AOV often uncovers opportunities that sitewide AOV masks.
Practically, AOV informs decisions across pricing, bundling, promotions, and checkout UX. When used with lifetime value (LTV), customer acquisition cost (CAC), and conversion rate, AOV helps prioritize tests and investments — for example using a CRO testing prioritization framework to identify high-impact experiments and allocate resources efficiently.
Why is Average Order Value (AOV) important?
AOV is a force-multiplier for revenue: small percentage increases in AOV can produce outsized top-line gains without requiring more traffic. If acquisition costs are fixed or rising, increasing how much each order earns is often the most efficient lever to improve profitability.
Beyond revenue, AOV affects downstream metrics: higher order values tend to justify more aggressive customer acquisition spend, change product margin dynamics, and alter inventory and fulfillment planning. Monitoring AOV by channel or campaign surfaces whether promotions attract low-value orders or healthy buyers.
For teams focused on CRO and e-commerce growth, pairing AOV initiatives with conversion optimization and personalized experiences increases the chance of success; resources such as How to increase e-commerce conversions with Pathmonk highlight tactics that lift both conversion rate and per-order value.
Free template: CRO testing framework
Organize, prioritize, and execute conversion rate optimization tests with our framework.

How to calculate AOV
At its simplest, AOV is:
AOV = Total Revenue / Number of Orders
- Define the period (day, week, month, quarter) and ensure revenue and orders use the same boundaries.
- Exclude refunds or returns if you want net AOV; include them if your analysis depends on gross transaction volume. Document which approach you use.
- Segment AOV by traffic source, campaign, product category, device, or user cohort to reveal where improvements are most impactful.
- For lead-gen where revenue is indirect, map AOV to the average monetized value per qualified lead (for example, average customer revenue derived from that lead type divided by the number of leads).
- Use running averages or median order value alongside mean AOV to reduce noise from outliers; median is especially useful when large-ticket purchases skew the mean.
How to increase AOV
- Product bundling: Offer curated bundles or recommended add-ons to increase cart value. Bundles can be permanent or limited-time to create urgency.
- Cross-sell and up-sell within the funnel: Implement context-sensitive upsells on product pages and during checkout to present higher-margin alternatives or complementary items.
- Threshold-based incentives: Use free shipping or a discount that triggers at a strategic cart value to nudge customers above that threshold.
- Price anchoring and tiered pricing: Present price tiers and premium packages to make mid-to-high options more attractive and normalize higher spend.
- Checkout optimization: Reduce friction, promote express options, and recommend complementary items at the final touchpoint — small adjustments can convert hesitant buyers into larger baskets.
- Personalized recommendations: Use behavioral data to display relevant products that the customer is likely to add; personalization increases relevance and average spend.
- Limited-time promotions and urgency: Time-bound discounts or low-stock indicators encourage larger purchases if paired with clear value messaging.
- Subscription and continuity offers: Encourage customers to move from one-off purchases to subscriptions or pre-paid plans, increasing average per-order booking and LTV.
- Reward programs: Structure loyalty points around spend thresholds to incentivize slightly larger orders to hit the next rewards tier.
- Paid add-ons and service upsells: Offer expedited shipping, gift wrapping, warranties, or setup services during checkout to incrementally raise AOV.
- Tested pricing experiments: Run controlled pricing and offer tests (including pricing split testing) to learn elasticities and identify price points that maximize revenue and margin.
- Segment-targeted merchandising: Customize product assortments and offers by visitor intent, channel, or past behavior to match purchase propensity and willingness to spend.
For practical experimentation on pricing and checkout offers, pricing split tests are an effective method to validate friction-free AOV increases without damaging conversion. See Pricing Split Testing for Increased Conversion Rates for an operational approach to testing price and offer variations.
How Pathmonk increases Average Order Value (AOV)
Pathmonk combines AI-powered personalization, micro-experiences, and intent-based journeys to improve the relevance of offers and product recommendations at key moments. By detecting visitor intent in real time, Pathmonk surfaces the most persuasive suggestions: bundles, higher-tier products, or succinct incentives that increase the likelihood of adding items or choosing premium options.
Pathmonk’s cookieless technology and privacy-forward tracking preserve effectiveness across modern browsers, while its analytics layer ties micro-experimentation to revenue outcomes so teams can attribute AOV changes to specific journeys. This means marketers can test prioritized CRO ideas quickly, measure AOV lift by segment, and scale winning experiences without invasive tracking.
In practice, Pathmonk helps prioritize experiments that have a high chance of moving AOV (and overall revenue) by combining quantitative signals with qualitative intent data; that shortens the path from hypothesis to measurable uplift and improves ROI on testing programs.
Related articles
- E-Commerce Conversion Optimization: How to Boost Sales with CRO
- How to increase e-commerce sales with Pathmonk
- How to Increase Customer LTV with AI-Powered Personalization
- Conversion Rate Optimization Best Practices from 16 Specialists
- ChocoVivo Boosted 21% Sales With Pathmonk
- The Science of High-Converting Landing Pages
Increase +180%
leads
demos
sales
bookings
from your website with AI
Get more conversions from your existing website traffic delivering personalized experiences.

FAQs on AOV
How often should I track AOV?
Average Order Value (AOV) is one of the most important metrics to keep an eye on because it directly reflects how much your customers are spending each time they place an order. Ideally, you should track AOV continuously so that you always have a clear picture of your revenue per order, but the way you review and act on it should follow a regular rhythm that matches your decision cycles.
A weekly review is useful if you want to see the immediate impact of a promotion, a limited-time discount, or a new upsell flow. A monthly review is better when you want to compare performance across marketing channels and campaigns, since this helps you understand whether email, paid ads, SEO, or social campaigns are driving higher-value orders. A quarterly review is especially helpful when you’re making bigger, more strategic decisions about pricing, bundling, or merchandising since those shifts tend to show results over a longer time horizon.
When reviewing AOV, always compare like-for-like periods to avoid being misled by seasonality, and remember to adjust for returns, cancellations, or unusually large spikes from a single promotion. This way, you’ll have a balanced and accurate view of your customers’ spending behavior.
Is median order value better than mean AOV?
Both mean and median order value provide useful insights, but they serve different purposes. The mean AOV is calculated by dividing total revenue by the number of orders, and it tells you how much revenue you’re generating on average per order.
This is critical for financial forecasting and revenue analysis. However, mean AOV can be easily skewed by outliers, such as a few customers making very large purchases or bulk orders. This is where the median order value becomes helpful. The median shows the “middle” order in your data set and is less sensitive to extreme values, which means it represents the spending pattern of a typical customer more accurately. If your business occasionally receives very large orders, the median gives you a more realistic picture of what most people spend.
The best practice is not to choose one over the other, but to use them together. The mean shows overall revenue impact, while the median highlights the typical customer experience. Comparing both helps you identify whether your AOV is being propped up by a small number of big spenders or whether the majority of customers are naturally increasing their order size.
Does increasing AOV hurt conversion rate?
Efforts to increase AOV can sometimes backfire if they introduce friction into the buying process or make customers feel pressured. For example, if your upsell flows are too aggressive or confusing, shoppers may abandon their carts instead of completing their purchases. However, when done right, AOV strategies don’t hurt conversions — they enhance them.
The key is to focus on relevance, simplicity, and value. Upsell and cross-sell recommendations should feel like natural extensions of what the customer already wants, not like random add-ons. For instance, suggesting a laptop bag to someone buying a laptop is much more effective than pushing unrelated products. Similarly, offering bundle discounts or free shipping thresholds can encourage customers to add more items without feeling coerced. Another effective approach is to use contextual product recommendations based on browsing behavior, which makes the offer feel personal and timely.
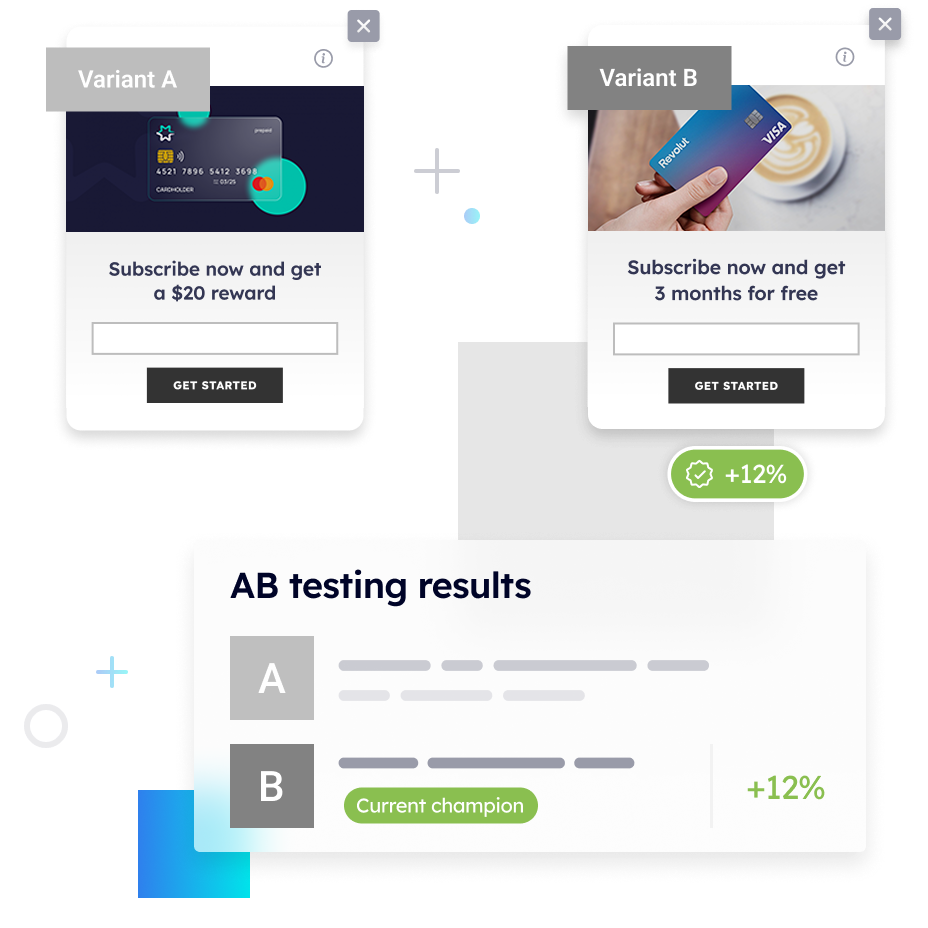
The golden rule is to make the larger purchase feel like the smarter choice rather than the harder choice. To be sure you’re not unintentionally lowering conversion rates, always A/B test your strategies before rolling them out widely. Testing allows you to confirm whether your efforts are encouraging customers to spend more without scaring them away from completing their orders.
How does AOV interact with customer lifetime value (LTV)?
AOV and customer lifetime value (LTV) are closely connected because AOV is one of the main components of the LTV formula. LTV is typically calculated as the product of AOV, purchase frequency, and retention period. This means that if you successfully increase your AOV while purchase frequency and retention remain stable, your customer lifetime value will rise automatically. For example, if your average customer normally spends $50 per order and places four orders a year, their annual value is $200. If you raise the AOV to $60 without changing anything else, that customer’s annual value immediately rises to $240. When you combine AOV improvements with strategies that increase how often people buy or how long they stay loyal to your brand, the impact multiplies.
This is why optimizing AOV should be seen as part of a broader retention and growth strategy, not as a standalone goal. Companies that focus only on order size without considering repeat purchases or customer loyalty risk short-term gains but may miss the bigger picture. On the other hand, businesses that improve both AOV and retention can unlock exponential growth in lifetime revenue, making this combination one of the most powerful levers for sustainable success.
Related terms
- Conversion Rate (CR)
- Customer Lifetime Value (LTV)
- Average Revenue Per User (ARPU)
- Cart Abandonment Rate


