

Google Analytics is still treated as the source of truth for website data, but in GA4, a growing part of what you see is no longer measured. It is inferred.
Shocking, right?
And yet, if you’re operating in a consent-first environment, GA4 is not reporting exact user behavior anymore, but rather estimating it. When users do not accept analytics cookies, GA4 fills the gaps using behavioral models trained on other users. Those estimates are then blended into your reports, often without a clear boundary between what actually happened and what was statistically reconstructed.
At the same time, GA4 actively hides parts of your data. The now-familiar “(other)” row is not a technical limitation or a UI shortcut, but a deliberate decision to withhold granular information when Google lacks confidence, hits internal thresholds, or triggers privacy safeguards.
This creates a dangerous illusion where reports look ok, yet the closer you get to real decision-making questions, such as user journeys, drop-off points, or conversion paths, the more GA4 smooths, estimates, or collapses reality.
In this article we take a technical look at how GA4 models user behavior, why it hides long-tail data, and what that means for anyone relying on Google Analytics to understand what is actually happening on their website.
Table of Contents
Google: the repeated suspect when numbers don’t add up
Long before GA4, marketers were already used to inflated, overly optimistic reporting across Google’s ecosystem. PPC is the most obvious example. Clicks that don’t turn into sessions. Sessions that never lead to real engagement. Leads that look great in Google Ads but turn out to be from their partner network (aka crap leads).
For years, this was brushed off as “attribution differences” or “tool discrepancies.” In practice, it meant one thing: Google was grading its own homework.
Ad platforms have a structural incentive to over-report performance. More conversions justify more spending. More attributed impact reinforces trust in the platform. And because Google controls the ad delivery, the tracking, and the reporting layer, it also controls the narrative when numbers don’t line up.
So what’s happening with GA4 now?
What changed recently with GA4 is Google’s tolerance for uncertainty. Instead of showing gaps when data is missing, GA4 actively fills them. Instead of acknowledging blind spots, it smooths them over. And instead of exposing limitations, it hides them behind estimated users, blended identities, and collapsed dimensions.
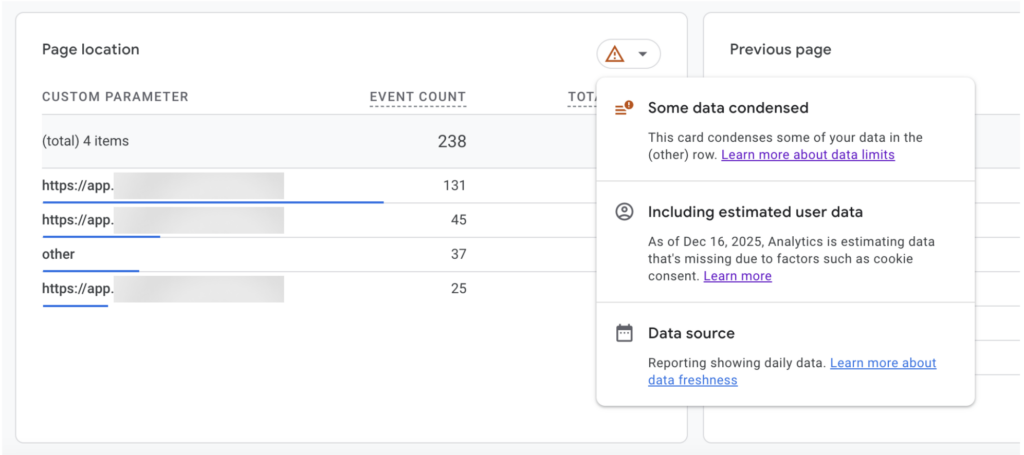
If you’re familiar with GA4, you may have seen this box recently. Or maybe not, because it’s quite well hidden in the interface.
When you explore any event report in GA4, you’ll notice a small red warning icon in the top right corner. Hover over it, and Google reveals what’s really going on under the hood about how your data is being processed.
- “Some data condensed”: This means GA4 has grouped part of your data into the “(other)” row. The events were allegedly collected, but their individual values are no longer shown at reporting level. This supposedly happens when GA4 hits internal thresholds or lacks enough confidence to rank all dimension values individually.
- “Including estimated user data”: This confirms that consent mode behavioral modeling is active. When users do not consent to analytics storage, GA4 does not stop reporting altogether. Instead, it estimates their behavior based on patterns observed from users who did consent, and blends those estimates directly into your reports.
- “Data source: reporting showing daily data.” This refers only to data freshness. It does not indicate whether the data is observed or modeled, only how often reports are updated.
In short, GA4 is telling you that part of the data you are looking at has been condensed, part has been estimated, and none of this is visually separated in the report itself. From here on, every metric in that view needs to be read with that context in mind.
Let’s analyze the first two warnings and their implications:
1. “Some data condensed”: when GA4 decides what you’re allowed to see
At first glance, the “(other)” row looks like a generic reporting limit: “Some data condensed.” When GA4 determines that a dimension exceeds internal limits, or that the distribution of values cannot be ranked with sufficient confidence, it groups part of the data into the “(other)” row. Only a subset of dimension values is shown. The rest are collapsed.
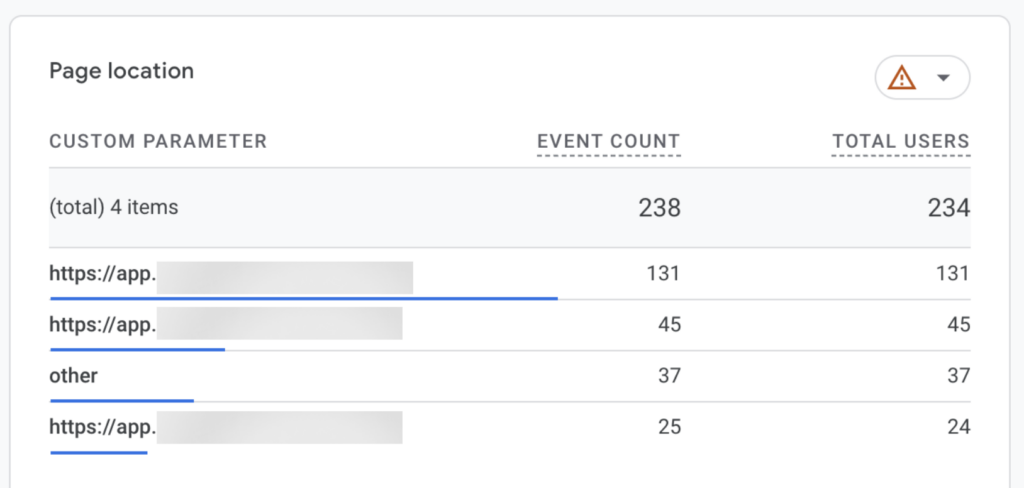
What is important here is not that condensation happens, which could be understandable, but how inconsistently it happens.
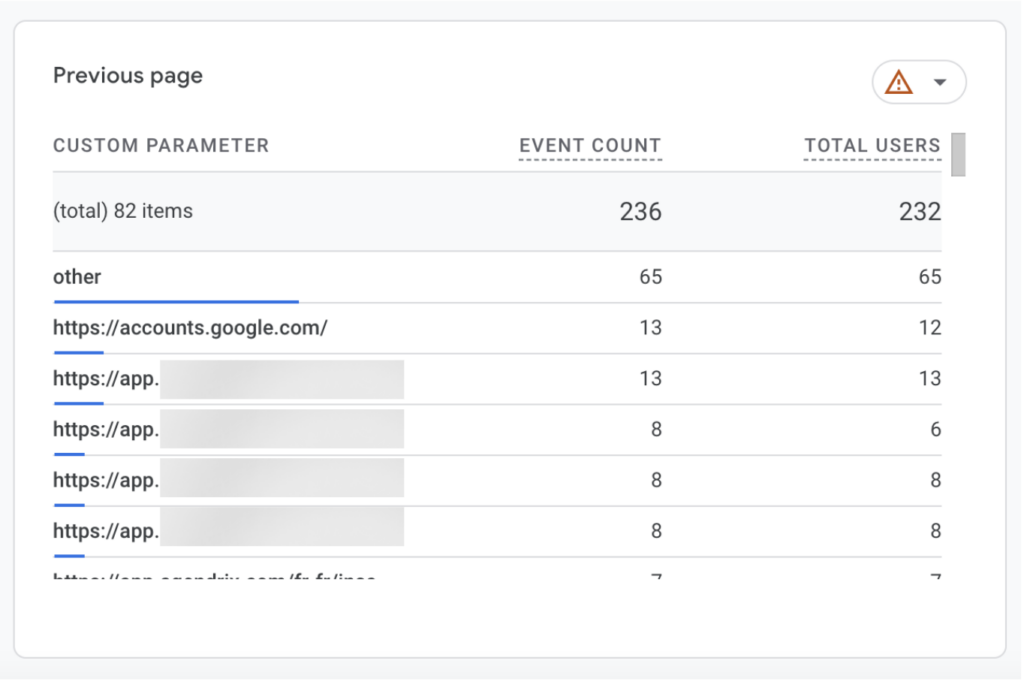
In the examples above, from the same customer for the same time period, one report displays only three page locations before collapsing the remaining values into “(other)”. Another report, using a comparable metric and time range, displays more than 80 distinct values before applying the same aggregation.
This immediately shows that the “(other)” row is not triggered by a fixed row limit or a simple volume threshold. GA4 is clearly capable of rendering long lists of dimension values when it considers the underlying data stable enough.
The difference lies in GA4’s internal confidence in the data feeding each dimension.
Dimensions that are more directly observed and less affected by consent-related fragmentation are allowed to surface in full. Dimensions that rely on partially modeled data, inferred identities, or unstable attribution are aggressively collapsed. In those cases, GA4 prefers to suppress the long tail rather than expose uncertainty in the distribution.
The “(other)” row therefore does not indicate missing data. It indicates selective visibility based on GA4’s internal heuristics.
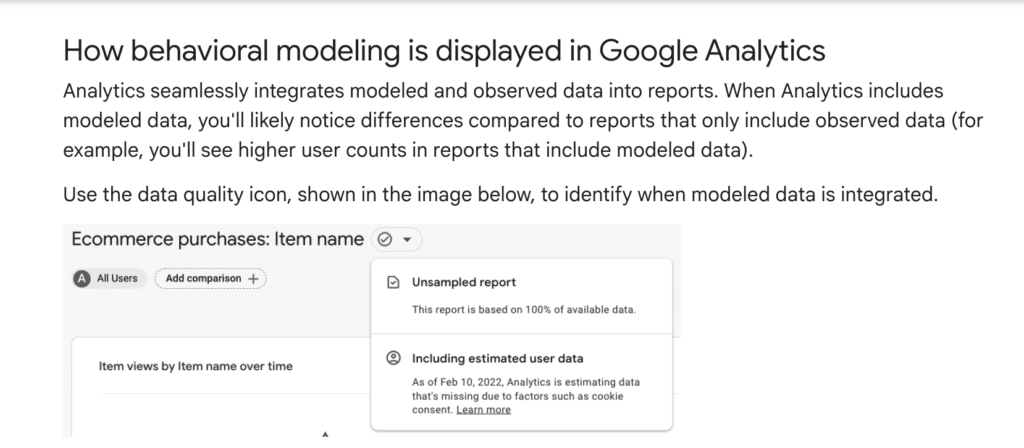
2. “Estimated user data”: how GA4 reconstructs users instead of counting them
The second message in the warning box is more explicit: “Including estimated user data.” Unlike the “data condensed” notice, this one goes straight to how GA4 now handles missing consent.
Google is very clear about this in its own documentation. When users do not consent, Analytics cannot tell whether ten pageview events represent ten users or a single one repeatedly reloading a page. Instead of leaving that ambiguity visible, GA4 applies what Google calls consent mode behavioral modeling. It analyzes the behavior of users who did consent to analytics storage, identifies “similar” patterns, and uses machine learning to estimate the behavior of users who did not.
Those estimates are then included back into reports as modeled or estimated users.
In earlier versions of Google Analytics, this loss of visibility was obvious. Reports showed fewer users, sessions broke, and funnels had gaps. Since December 2025, Google has chosen to compensate for those gaps rather than expose them. Modeled users are not shown separately from observed ones. They are blended directly into user counts, trends, and breakdowns, with no visual distinction between measured behavior and inferred behavior unless you actively inspect a small data quality icon or change the identity setting for reports, but even Google warns of inflated numbers on their reports.
Google presents this as a way to “extract valuable statistics while respecting user privacy.” Technically, what it means is that metrics such as daily active users, new users, key event rates, user journeys, and geographic breakdowns may include behavior that never actually occurred, but was inferred based on statistical similarity.
That detail matters, because consent rates are not random. They vary significantly by geography, device, traffic source, and intent. Users who accept cookies tend to behave differently from users who don’t. By extrapolating from this subset, GA4 is not correcting for missing data, but amplifying the bias already present in the consenting audience. The fact that the model adapts “to your business” only reinforces this effect.
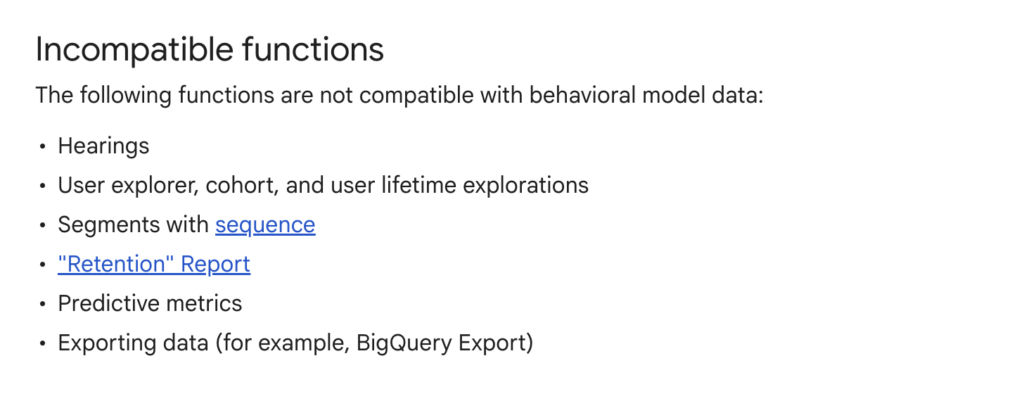
Google documents these limitations. It even lists entire features that are incompatible with modeled data, including user explorer, cohort analysis, retention reports, predictive metrics, and BigQuery exports. Yet in the interface, modeled and observed users are presented together, with the same charts, the same labels, and the same apparent precision.
At that point, the issue is not whether GA4 is compliant or sophisticated. It’s whether the platform is still describing what actually happened on the website, or whether it is describing what its models consider statistically plausible.
How Pathmonk tracks user behavior (without guessing)
Pathmonk’s analytics are built around a very different premise from GA4. Our technology does not rely on cookies or consent banners to identify visitors. Instead, it uses proprietary fingerprint technology that combines browser, device, and behavioral signals to recognize visitors in a privacy-compliant way. This fingerprint is anonymous by design and does not store personal data, but it remains stable enough to recognize returning visitors across sessions, even if cookies are rejected or cleared.
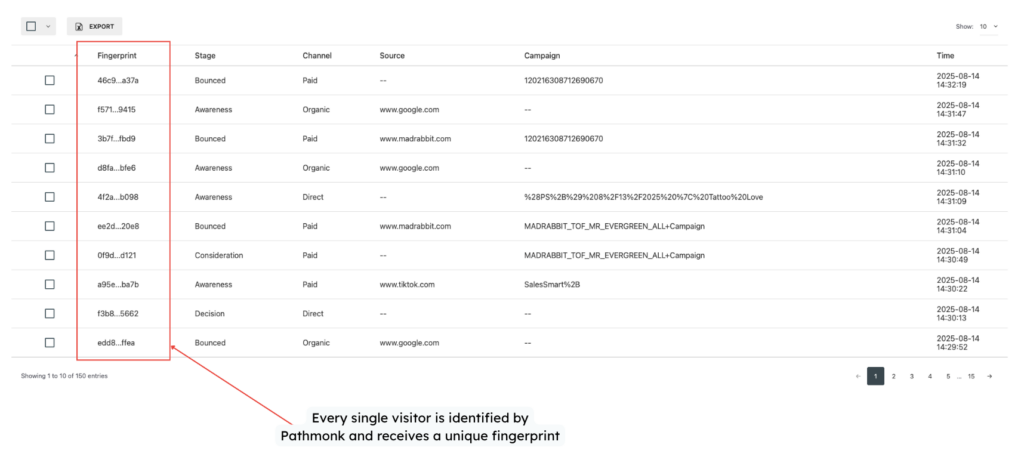
This approach allows Pathmonk to identify every visitor who interacts with the website and to follow their journey over time without interruption. Unlike GA4, Pathmonk does not lose visibility when consent is denied, and therefore does not need to reconstruct users or estimate behavior after the fact. If a visitor comes back, Pathmonk can recognize them. If they progress through multiple sessions before converting, that journey remains intact.
Because identification is deterministic rather than probabilistic, Pathmonk can track complete buying journeys from first visit to final conversion without blending observed data with modeled assumptions. Sessions, events, and progression through the funnel are based on actions that actually occurred, not on extrapolations from other users.
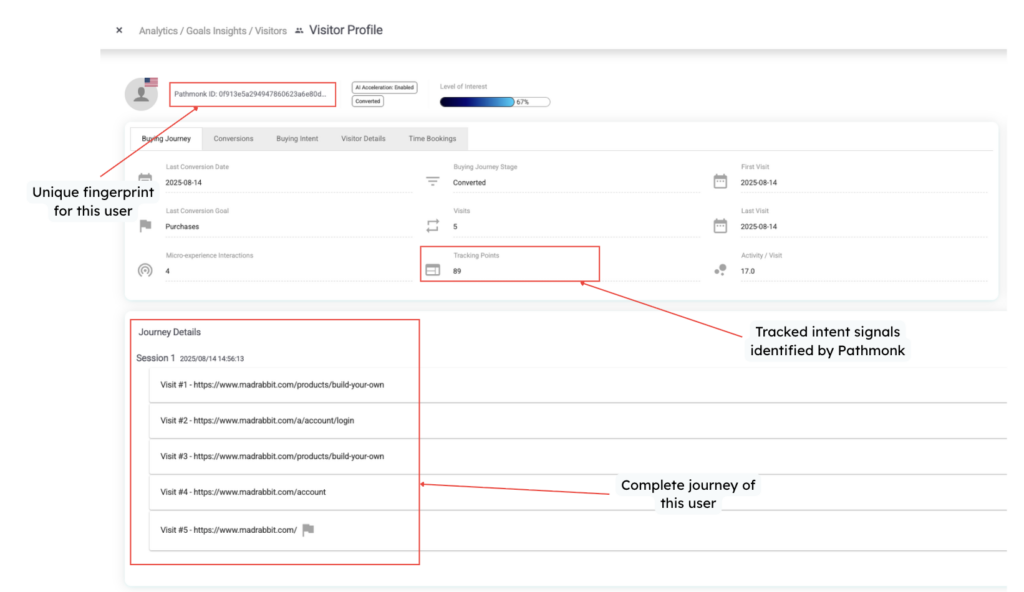
On top of identification, Pathmonk focuses on understanding behavior in context. Rather than limiting analysis to pageviews or isolated events, the platform tracks micro-actions such as scrolling, time spent on sections, interactions with elements, and navigation patterns. These signals are used to interpret visitor intent and determine where each visitor sits in the buying journey: awareness, consideration, or decision.
This intent-based analysis is applied consistently across the entire dataset. There are no “estimated users,” no hidden long-tail behavior, and no collapsing of journeys due to reporting thresholds. If Pathmonk cannot observe a behavior, it does not infer it. And if it observes it, it remains visible at every level of analysis, from aggregated dashboards down to individual visitor journeys.
As a result, Pathmonk’s analytics provide a unified and uninterrupted view of performance. You can see how traffic sources bring visitors to the site, how those visitors behave across pages and sessions, how they progress through the buying journey, and which actions ultimately lead to conversions. Bot traffic is identified and separated, ensuring that analytics reflect human behavior only.
If you want to learn more technical details about how Pathmonk works, check these articles:
Translate all your data into clear insights
Discover how to future-proof your marketing data strategy with AI-powered analytics.
Free download
Other factors that affect reporting differences between Pathmonk and GA4
Even after accounting for GA4’s modeling and Pathmonk’s deterministic identification, there are additional factors that can cause reporting differences between the two platforms. These are not inconsistencies, but consequences of how each system defines and processes data.
Bot traffic
Pathmonk identifies and classifies bot traffic more aggressively than most analytics tools. Automated visits, crawlers, and non-human interactions are detected and separated from human behavior at tracking level.
This can have a noticeable impact on reported visitor numbers, especially on websites that receive a significant amount of automated traffic from scrapers, monitoring tools, or AI agents. In Pathmonk, bot traffic is excluded from buyer journeys and behavioral analysis by default, ensuring that intent and conversion data reflects human behavior only.
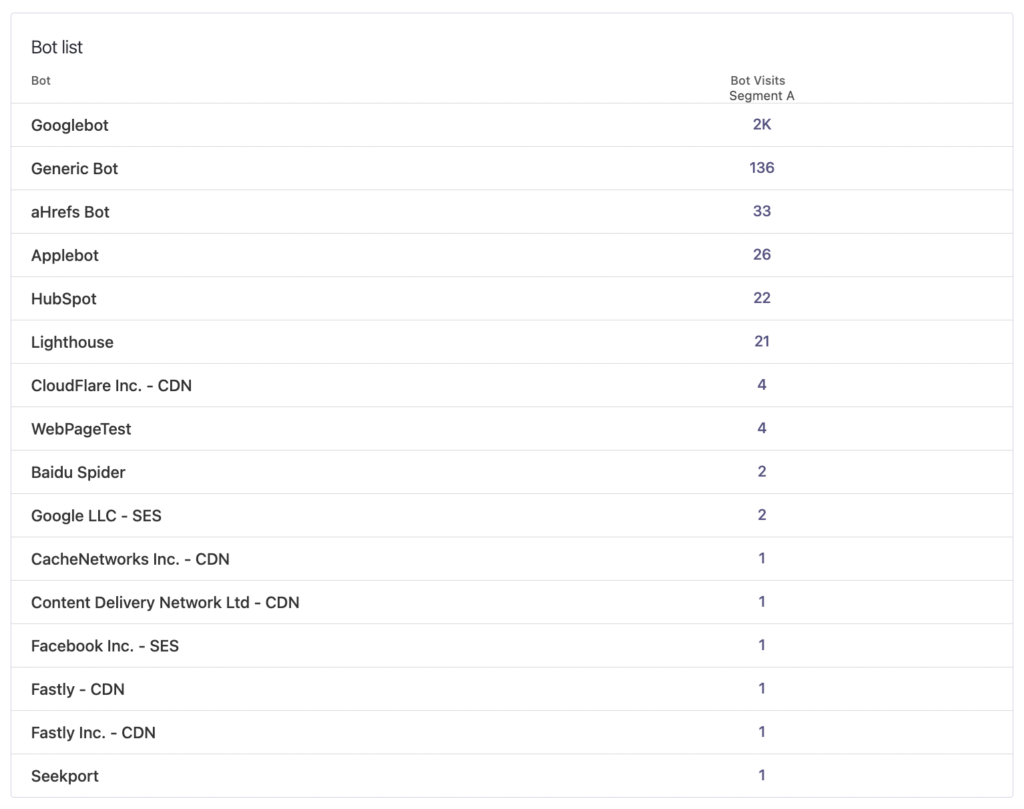
GA4, by contrast, relies on a more permissive filtering model and often includes a portion of automated traffic in standard reports, particularly when bots mimic human browsing patterns.
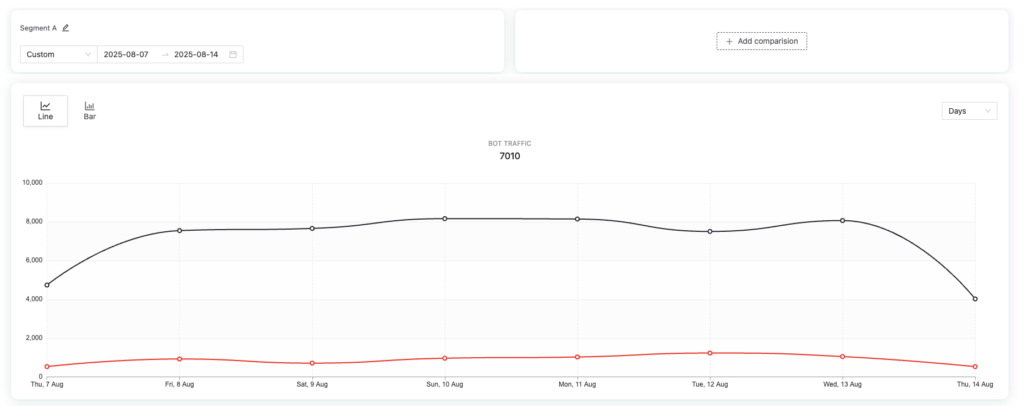
Pathmonk does still track bot traffic transparently. You can review it at any time under Analytics → Dashboard → Bot Traffic, but it does not count toward subscription pageviews or behavioral insights.
Visitor continuity across sessions and devices
Pathmonk tracks unique visitors across sessions and devices, not just isolated visits.
Because Pathmonk uses fingerprint technology instead of cookies, it can recognize the same visitor even if they:
- return in a new browser session
- clear or reject cookies
- switch devices (for example, from mobile to desktop)
All of that activity is consolidated into a single visitor profile and a single buying journey. This makes it possible to analyze how behavior evolves over time, across touchpoints, and across devices, which is especially relevant for longer or more complex buying cycles.
GA4 is not built for this level of continuity, as it relies on cookies, consented identifiers, and session-based tracking. When those identifiers are missing, reset, or blocked, GA4 treats the same person as multiple users or multiple new sessions. This fragments journeys and inflates user counts, particularly in consent-heavy environments or on sites with repeat visitors.
As a result, Pathmonk often reports fewer but more accurate unique visitors, while GA4 reports higher numbers that may represent the same person multiple times under different identities.
This difference alone can explain substantial discrepancies between Pathmonk and GA4, especially for B2B websites, high-consideration products, or any scenario where users return multiple times before converting.
Different goals, different definitions
Finally, it’s important to acknowledge that GA4 and Pathmonk are optimized for different purposes.
GA4 prioritizes continuity and comparability in a consent-constrained environment, even if that means modeling users and smoothing data. Pathmonk prioritizes behavioral accuracy and journey continuity, even if that results in lower but more defensible numbers.
When you compare the two, you are not comparing like for like. You are comparing modeled identity-based analytics with observed, fingerprint-based behavioral analytics.
Which numbers should you trust? Integrating Pathmonk’s analytics and GA4
In practice, most marketing teams still report on GA4. It’s the industry default, it’s deeply embedded in dashboards, and it’s often the common language between marketing, leadership, and finance. We’re fully aware of that reality.
The problem is that GA4 is not a neutral source of truth. As we’ve shown throughout this article, part of what it reports is modeled, part is hidden, and part is reconstructed to maintain continuity in a consent-first world. That doesn’t make GA4 useless, but it does mean it shouldn’t be used in isolation.
Pathmonk is not meant to replace GA4 dashboards overnight, though it has the capacity to be your by-default analytics tool. It’s designed to act as a contrast layer: a way to validate what you’re seeing, understand what’s real behavior versus modeled assumptions, and ground decisions in observable buying journeys.
If you want:
- to understand real visitor intent
- to optimize conversion experiences based on actual behavior
- to analyze complete journeys across sessions and devices
- to work without cookies or consent bias
Then Pathmonk’s numbers give you the veracity GA4 can no longer guarantee on its own.
Because we know most teams still rely on GA4, we’ve built a native integration between GA4 and Pathmonk. This allows you to import historical GA4 data, compare GA4 and Pathmonk results in real time, and synchronize conversion goals so your data stays aligned across both platforms.
This integration also helps Pathmonk’s AI learn from your past traffic patterns, improves result accuracy, and gives you a clearer, more contextual view of your buying journeys, without forcing you to abandon the tools your team already uses.
If you’d like access to the GA4–Pathmonk integration, just reach out to our team at support@pathmonk.com.
TL;DR: key takeaways
- GA4 no longer reports only observed behavior. Part of its data is modeled, part is collapsed, and part is reconstructed to compensate for missing consent.
- The “(other)” row is not a fixed reporting limit. It reflects selective visibility based on GA4’s internal confidence and heuristics.
- “Estimated user data” means GA4 is inferring users and journeys using behavioral models trained on consenting traffic.
- Modeled and observed data are blended in GA4 reports, with no clear separation in standard views.
- Pathmonk tracks visitors using deterministic fingerprint technology, not cookies or consent-based identifiers.
- Pathmonk never estimates or reconstruct behavior. If something cannot be observed, it is not inferred.
- Pathmonk provides complete, uninterrupted buying journeys across sessions and devices.
- GA4 and Pathmonk numbers are not supposed to match. They measure fundamentally different things.
- GA4 remains useful for standardized reporting. Pathmonk adds veracity by grounding decisions in observable behavior.
- The GA4–Pathmonk integration allows teams to compare both realities side by side and keep data aligned.
Increase +180% conversions from your website with AI
Get more conversions from your existing traffic by delivering personalized experiences in real time.
- Adapt your website to each visitor’s intent automatically
- Increase conversions without redesigns or dev work
- Turn anonymous traffic into revenue at scale