
What is a good conversion rate benchmark for my industry? A “good” conversion rate depends on industry, conversion type, and traffic intent, but there are reasonable benchmark ranges that can be used as a sanity check.
Across most industries, average website conversion rates typically fall between 1% and 4% for primary actions such as purchases, demo requests, or lead submissions. Ecommerce sites often convert between 1% and 3%, while B2B SaaS, professional services, and lead generation sites commonly see averages closer to 2% to 5%, depending on funnel complexity and audience quality.
These benchmarks are not performance targets. Conversion rates vary widely based on factors such as traffic source, device mix, pricing, and how close users are to a buying decision. A lower conversion rate on high-intent traffic can outperform a higher rate driven by low-quality leads.
Benchmarks are most useful for orientation, not evaluation. A more reliable way to assess performance is to track improvement over time, compare high-intent versus low-intent segments, and analyze how users move through conversion paths. Intent-based optimization approaches, including tools like Pathmonk, reduce reliance on static benchmarks by adapting experiences in real time based on user behavior.
Table of Contents
Conversion rate benchmarks are one of the most searched, shared, and misunderstood metrics in digital marketing. At some point, almost every team asks the same question: what is a good conversion rate for our industry?
The appeal is obvious. Benchmarks promise clarity. A single number that tells you whether you’re doing well, underperforming, or ahead of the curve. They’re easy to put in reports, easy to compare against competitors, and easy to use as targets.
The problem is that conversion rate benchmarks are often treated as absolutes when they are anything but.
Industry averages collapse very different business models, traffic sources, funnel structures, and conversion definitions into one number. Two companies in the same industry can have wildly different “good” conversion rates and still be equally successful from a revenue standpoint. Without context, benchmarks can just as easily mislead as inform.
That doesn’t mean benchmarks are useless. It means they need to be used correctly.
In this article, we’ll look at real conversion rate benchmarks by industry, based on data from widely cited sources. More importantly, we’ll explain what those numbers actually represent, why they vary so much, and how to use them as reference points rather than performance goals.
What conversion rate benchmarks actually measure
Before looking at industry numbers, it’s worth being clear about what a conversion rate benchmark is and, just as importantly, what it is not.
A conversion rate benchmark is a reference value, usually expressed as an average or range, calculated from the performance of many different websites within the same industry. It reflects how often a defined action occurs, such as a purchase, form submission, or demo request, across that aggregated sample.
In most published reports, benchmarks are built from:
- Large datasets spanning hundreds or thousands of companies
- Aggregated website-level performance
- A single primary conversion action
These benchmarks are useful for orientation. They give a rough sense of what is common across a market. They do not describe what is optimal, achievable, or appropriate for a specific business.
What benchmarks usually include is scale. What they usually exclude is context.
- They do not account for traffic quality. A site driven primarily by high-intent branded traffic will naturally convert at a higher rate than one relying on broad, informational queries or cold paid acquisition. Benchmarks typically blend these together.
- They also ignore user intent. Visitors researching a problem, comparing solutions, and ready to buy are often treated as a single audience, even though their likelihood to convert is fundamentally different.
- Funnel complexity is another major omission. A one-step ecommerce checkout and a multi-touch B2B sales funnel may both report a “conversion rate”, but the effort, risk, and commitment behind those actions are not comparable.
- Finally, benchmarks rarely normalize for conversion definition differences. What counts as a conversion can range from a newsletter signup to a high-intent demo request. Even within the same industry, these actions carry very different expectations and success rates.
They are reference points, never verdicts. Interpreting them correctly requires knowing what they measure, and what they leave out.
Get your website’s conversion score in minutes
- Instant CRO performance score
- Friction and intent issues detected automatically
- Free report with clear next steps
Conversion rate benchmarks by industry (2026 update)
The ranges below are based on aggregated data from widely cited industry reports (including Wordstream, Ruler Analytics, HubSpot, Shopify, IRP Commerce, and First Page Sage). They represent typical outcomes across many companies and should be used as reference points, not targets.
Note: these results represent primary website conversions such as purchases, demo requests, or lead submissions. Newsletter signups and other micro-conversions are excluded.
Category (industry or business model) | Average | Strong | Top-performing |
B2B SaaS | 1.5%–3% | 3%–5% | 5%+ |
Enterprise B2B / high-ticket software | 0.5%–1.5% | 1.5%–3% | 3%+ |
Ecommerce | 1%–2% | 2%–3% | 3%+ |
Marketing agencies / professional services | 2%–4% | 4%–6% | 6%+ |
Lead generation (B2B services, consultants, software) | 2%–5% | 5%–8% | 8%+ |
Fintech / financial services | 1%–3% | 3%–5% | 5%+ |
Healthcare / health services | 1%–3% | 3%–5% | 5%+ |
Education / online courses | 2%–5% | 5%–8% | 8%+ |
Real estate | 1%–3% | 3%–6% | 6%+ |
Travel & hospitality | 1%–3% | 3%–5% | 5%+ |
Marketplaces (B2B or B2C) | 1%–2.5% | 2.5%–4% | 4%+ |
Media / publishers (subscriptions or leads) | 0.5%–2% | 2%–4% | 4%+ |
Content-heavy / organic-driven sites | 0.5%–2% | — | — |
Increase +180% conversions from your website with AI
Get more conversions from your existing traffic by delivering personalized experiences in real time.
- Adapt your website to each visitor’s intent automatically
- Increase conversions without redesigns or dev work
- Turn anonymous traffic into revenue at scale

Why industry benchmarks are often misleading in practice
The problem with conversion rate benchmarks is not how they are calculated, but how they are used.
In practice, benchmarks tend to become targets, even when no one explicitly says so. Teams start optimizing to “reach the industry average” instead of improving the underlying economics of the business. That shift sounds harmless, but it has consequences.
- One common issue is optimizing for the metric, not the outcome. Teams push for higher conversion rates by lowering friction indiscriminately, simplifying forms, or broadening CTAs. Conversion rate goes up, but lead quality drops. Sales teams feel the impact long before dashboards reflect it.
- Another issue is false underperformance. A company may sit below an industry benchmark while still outperforming peers in revenue, pipeline value, or customer lifetime value. This is common in enterprise SaaS and high-ticket B2B, where fewer, better conversions matter more than volume. Benchmarks make these cases look like problems when they are not.
- Benchmarks also distort prioritization. When teams focus on closing a perceived gap to an average, they often ignore higher-impact opportunities such as segment-level optimization, intent differentiation, or improving later funnel stages. The result is activity without leverage.
- There is also a timing problem. Benchmarks are backward-looking by nature. They reflect what was common across many companies at a given moment, not what is effective for your audience right now. Using them as a reference is reasonable. Using them as a directional signal for optimization decisions is not.
This is why benchmarks work best as a starting point, not a scorecard. They help you understand the landscape, but they should not define success. Real performance comes from improving your own baseline over time and understanding how different types of users behave, not from matching an industry average.
What factors matter more than conversion averages?
If you want to understand performance, there are a few factors that consistently matter more than any benchmark.
- Traffic intent: Where visitors come from and why they arrive has a bigger impact on conversion than industry. Branded, referral, and bottom-of-funnel traffic convert very differently from informational or cold paid traffic.
- Conversion type and friction level: A purchase, a demo request, and a newsletter signup all represent different levels of commitment. Higher-friction actions convert at lower rates by design and should not be compared directly.
- Business model and sales motion: Self-serve products, sales-assisted SaaS, professional services, and marketplaces follow different decision paths. Conversion rates reflect those paths, not just demand.
- Baseline maturity: Sites early in their optimization journey often see faster gains because obvious friction exists. As maturity increases, improvements become smaller but more meaningful. Benchmarks do not account for this curve.
- Segment-level performance: High-intent users, returning visitors, and pricing-page traffic behave very differently from first-time or exploratory users. Improvements in these segments usually have more impact than lifting the site-wide average.
- Conversion paths, not pages: Users convert through sequences of interactions, not isolated pages. Optimizing the flow between steps matters more than increasing a single page’s conversion rate.
Real optimization starts by understanding who converts, under what conditions, and at which points in the journey.
Translate all your data into clear insights
Discover how to future-proof your marketing data strategy with AI-powered analytics.
Free download
From industry benchmarks to optimizing your own reality
Industry benchmarks are useful as an orientation tool. They help you understand what is common across similar businesses and whether your conversion rate is broadly within a typical range. That’s where their value largely ends.
What benchmarks cannot tell you is whether your conversion rate is good for your situation.
As we’ve seen, two companies can sit at the same conversion rate and perform very differently depending on traffic intent, funnel complexity, and lead quality. A lower conversion rate driven by high-intent users can outperform a higher rate inflated by low-quality traffic. This is why understanding your current baseline, and the quality of the conversions behind it, matters more than comparing yourself to an average.
The next step is optimization, but not in the sense of chasing a higher percentage for everyone.
Effective optimization starts by adapting the experience to the business you actually run: your audience, your sales motion, your buying cycles, and the signals your users give as they move through the site.
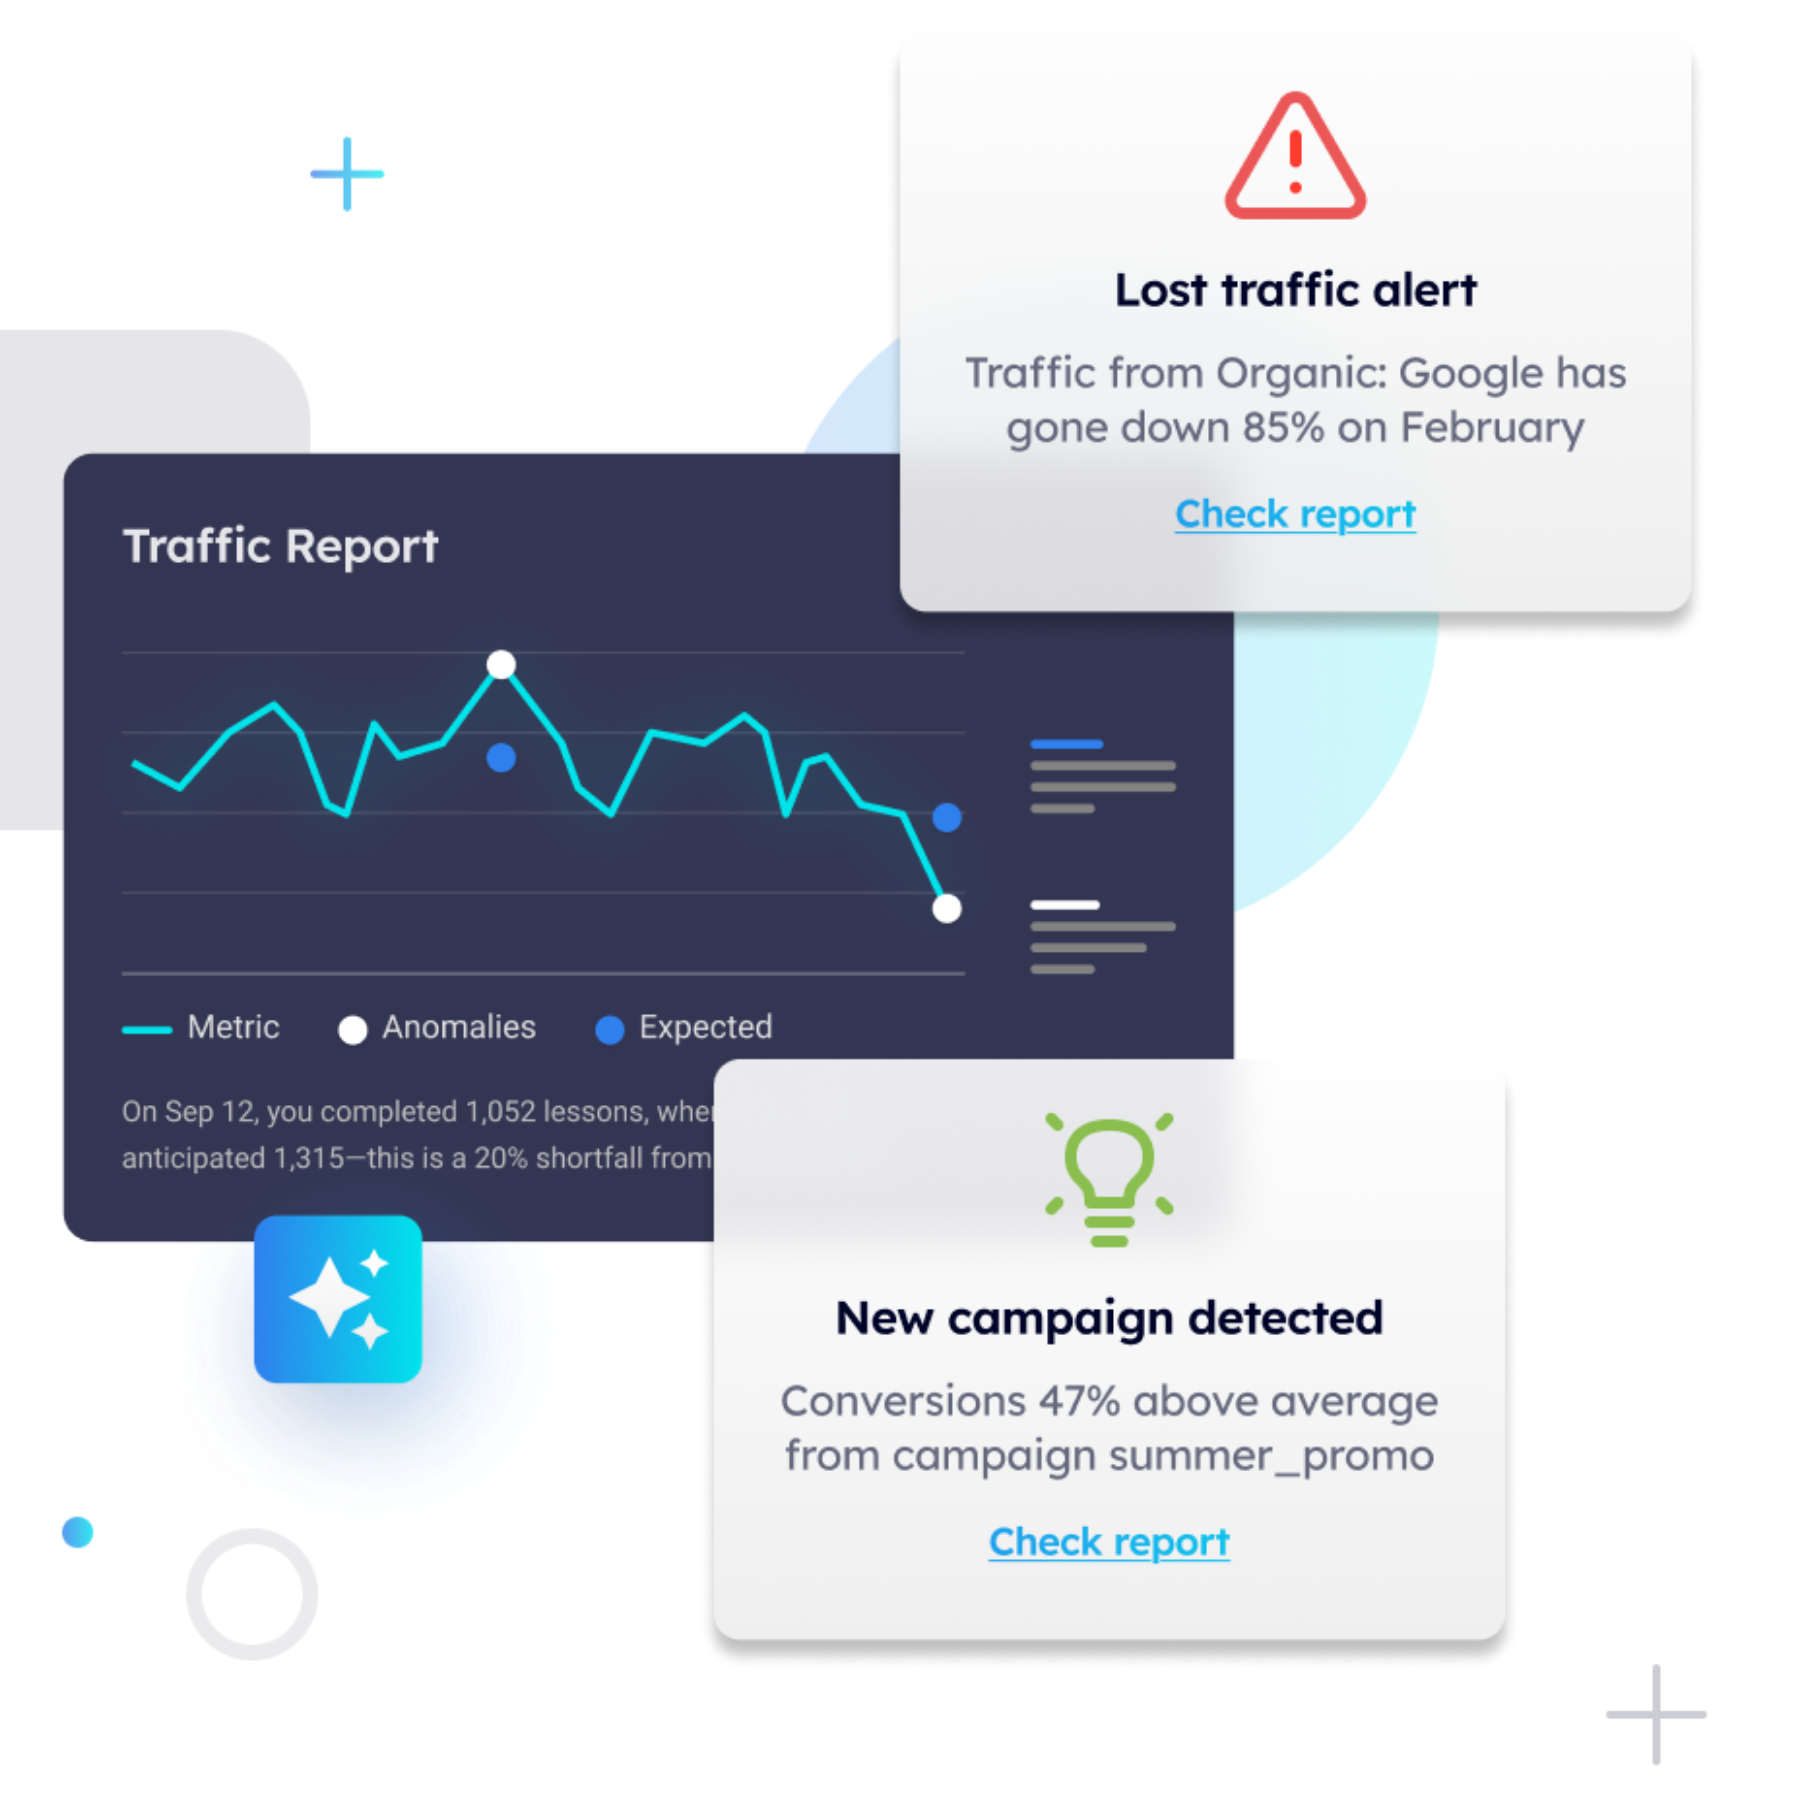
Pathmonk is designed to move beyond static benchmarks by focusing on how prospects behave in real time. It uses behavioral signals to predict intent and adjust the path to conversion accordingly, rather than pushing all visitors toward the same action. The system is trained on more than two billion behavioral data points collected across companies from different industries, which allows it to recognize common decision patterns while adapting them to each specific context.
In practice, this means optimization is grounded in your own data and user behavior, not in industry averages. Benchmarks still provide context, but performance is evaluated based on how efficiently high-intent users convert, how conversion paths evolve over time, and how lead quality improves as friction is reduced selectively.
The shift is subtle but important. Instead of asking whether your conversion rate matches an industry norm, the focus moves to whether your site is helping the right users convert at the right moment.
How Pathmonk increased B2B manufacturing website from 1.49% to 2.43% conversion rate (+63% increase)
A small change in conversion rate can look insignificant against industry benchmarks, but in high-intent, high-ticket environments, those gains often translate into meaningful business outcomes.
Forrest Technical Painting, a B2B manufacturing company focused on industrial coatings, had steady traffic but very few sales requests. The website was outdated and difficult to change, and the marketing team had no realistic way to run traditional CRO experiments or redesign the site.
Instead of revamping the website, which was beyond their resources, the focus shifted to improving how high-intent visitors moved through the buying journey.
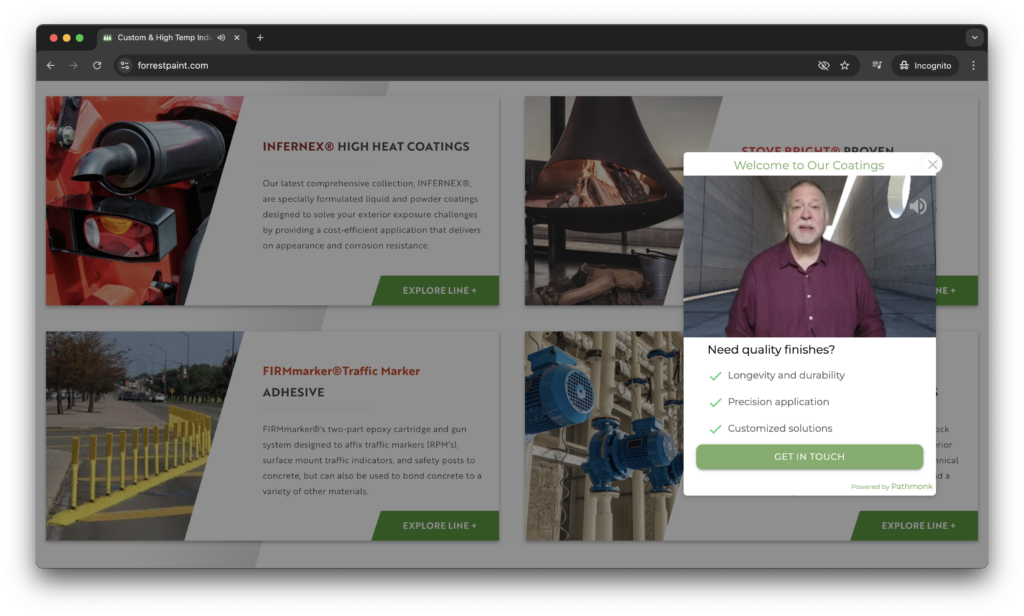
Pathmonk was used to identify visitor intent in real time and guide users toward the most relevant next step, from clarifying value for early-stage visitors to reducing friction for decision-stage users. This was done without modifying the website itself.
Over six months, this approach led to:
- +63% increase in conversion rate (from 1.49% to 2.43%)
- 169 additional sales requests directly attributable to Pathmonk
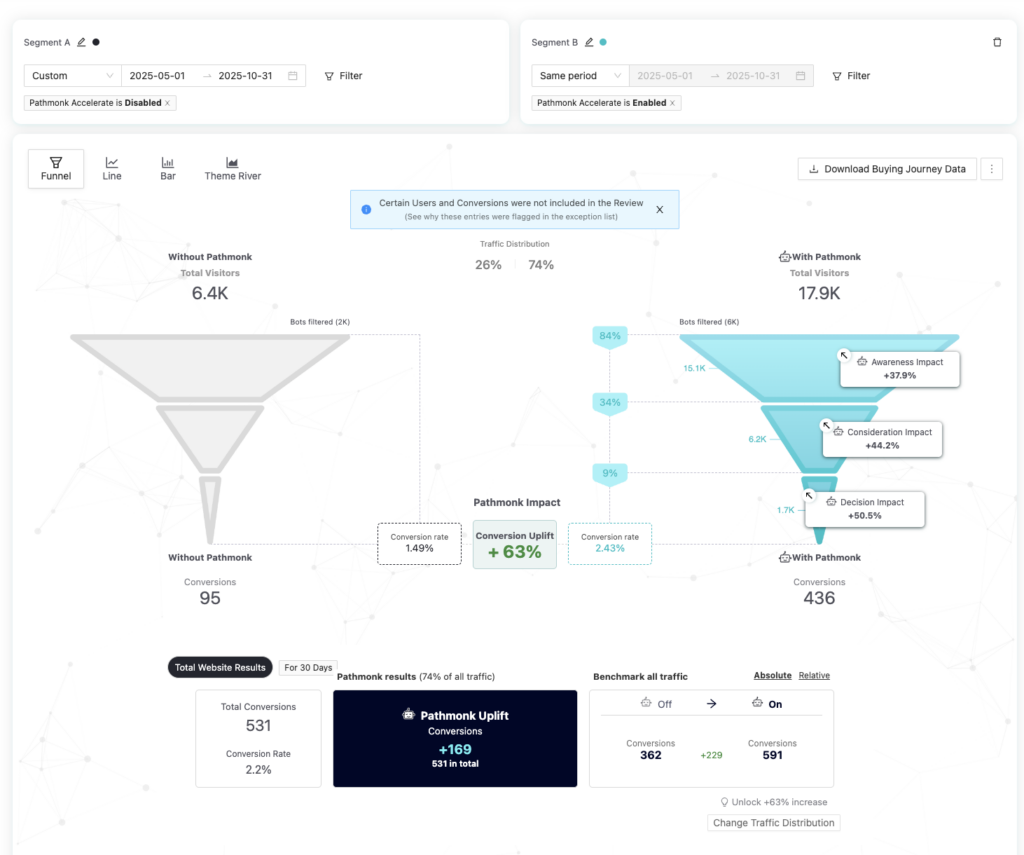
From a benchmark perspective, the final conversion rate still looked “average” for a B2B manufacturing site. From a business perspective, it represented a significant increase in qualified, high-value sales opportunities.
FAQs about conversion rates by industry
Are conversion rate benchmarks different for mobile vs desktop?
Yes. Desktop traffic typically converts at a higher rate than mobile, especially for complex or high-commitment actions such as demo requests or sales inquiries, though it depends heavily on the type of business. Mobile traffic often plays a stronger role earlier in the journey, while desktop is more common closer to conversion. Comparing device-agnostic averages can hide this difference.
Should I benchmark against competitors or industry averages?
Industry averages are usually more reliable than competitor benchmarks. Competitor data is rarely comparable because traffic mix, conversion definitions, and business models differ significantly. Benchmarks are best used as high-level reference points, not as direct performance targets.
Is a higher conversion rate always better?
Not necessarily. A higher conversion rate can be misleading if it comes from lowering friction indiscriminately or attracting low-quality leads. In many cases, a lower conversion rate paired with higher intent and better lead quality produces stronger business outcomes.
How often should conversion benchmarks be revisited?
Benchmarks should be revisited periodically, but not used for ongoing performance evaluation. They are most useful when entering a new market, launching a new funnel, or reassessing expectations. Day-to-day optimization should focus on internal baselines and trend improvements instead.
Why can two companies in the same industry perform well with very different conversion rates?
Because conversion rates are shaped by intent, funnel complexity, deal size, and sales motion. Two companies can convert at different rates and still generate similar revenue if the quality and value of their conversions differ. Industry labels alone do not capture this nuance.
Key takeaways
- Industry conversion rate benchmarks are useful as orientation, not as performance targets.
- A “good” conversion rate depends more on intent, conversion type, and sales complexity than on industry averages.
- Small percentage changes can represent significant business impact, especially in high-intent, high-ticket environments.
- Optimizing for conversion quality and efficiency often matters more than increasing the headline conversion rate.
- Benchmarks become misleading when they drive decisions instead of internal baselines and trend improvements.
- Behavior-based optimization helps move beyond averages by adapting the path to conversion to how users actually behave.