Landing page conversion optimization and UX are not in conflict by default. They become opposed only when optimization is treated as friction removal at any cost, rather than as intent matching. The highest-converting pages work because they reduce cognitive load for visitors who are ready to convert while giving enough context to those who are not, and this is fundamentally a UX problem.
The practical answer: optimize for visitor intent stage first, then reduce irrelevant friction, then test structural changes. Pages that skip the intent layer and go straight to aggressive CRO tactics (fewer fields, louder CTAs, countdown timers) often improve short-term conversion rates while degrading lead quality and increasing downstream churn. That is a tradeoff most teams do not measure.
Table of Contents
A 2023 study by Baymard Institute found that 69.99% of e-commerce checkout sessions end without a purchase, and the most cited reasons were not price objections but UX failures: unexpected costs, forced account creation, and forms that felt too long. These are conversion problems dressed as design problems. They share a common cause: the page was not designed around what the visitor needed at that moment.
The tension between conversion rate optimization and user experience has generated a decade of bad advice. On one side, growth teams treating every friction point as something to eliminate. On the other, UX designers protecting page integrity to the point of leaving obvious conversion gains untouched. Both miss the same thing: a high-converting landing page is one that makes the right action feel like the obvious next step for the right visitor at the right stage.
What has changed recently is the data available to act on this. Behavioral analytics can now segment by visitor intent in real time, not just by demographic or channel. Heatmaps, session recordings, and funnel analytics have matured. A/B testing infrastructure is accessible without engineering resources. The constraint is no longer tooling. It is the mental model teams use to decide what to test and why.
This article covers the mechanics of landing page optimization that consistently deliver conversion gains without degrading UX: how to diagnose friction correctly, where CTA architecture breaks down, how to match page experience to intent stage, and where teams consistently trade long-term funnel health for short-term click metrics.
Get your website’s conversion score in minutes
- Instant CRO performance score
- Friction and intent issues detected automatically
- Free report with clear next steps
The conversion-UX tension framework
Before deciding what to change, it is worth being precise about what “UX damage” actually means in conversion terms. The phrase gets used loosely to mean anything from “the page looks worse” to “we are annoying visitors.” Both matter, but they matter at different points in the funnel and in different ways.
Three categories of UX damage are worth separating:
- Cognitive friction is the experience of a visitor not understanding what to do next, why the offer matters, or how the product works. This kills conversions at the awareness and consideration stages and does not show up as a CRO problem. It shows up as low engagement metrics and high bounce rates on pages with otherwise clean design.
- Mechanical friction is the experience of a visitor who wants to convert but encounters barriers: too many form fields, unclear CTAs, broken mobile layouts, slow load times. This is the category most CRO work addresses. Reducing it raises conversion rates reliably, and doing so rarely hurts UX.
- Trust friction is the experience of a visitor who is interested but uncertain about security, credibility, or commitment. Removing a trust signal to simplify a page (for example, stripping out testimonials to reduce cognitive load above the fold) can raise clicks while lowering quality conversions or increasing refund rates.
The most durable gains come from reducing mechanical friction while preserving or improving cognitive clarity and trust density.
friction
friction
Low quality
High quality
Low quality
High quality

Where UX actually costs conversions
The majority of landing page conversion losses come from a small set of structural problems that have measurable, addressable causes.
1. Page load speed
Google’s internal data established that as page load time increases from one second to three seconds, the probability of a visitor bouncing increases by 32%. At five seconds, it is 90%. This is not a UX-versus-conversion tradeoff. Slow pages are both bad UX and bad for conversion rates simultaneously. A 100-millisecond improvement in load time has been correlated with a 1% increase in conversion rate in high-traffic e-commerce environments.
The most common sources of load speed degradation on landing pages are uncompressed images, third-party tracking scripts loading synchronously, and undeferred JavaScript. None of these are design decisions. They are implementation decisions that get overlooked when pages are built primarily in visual editors.
2. Above-the-fold clarity failure
Eye-tracking studies consistently show that visitors make a judgment about page relevance within the first 3 to 5 seconds and within the first two scrolls. If the value proposition is not clear, specific, and matched to the ad or email that drove the click, the visitor does not continue. This is cognitive friction: the page requires effort to understand before it earns the right to ask for action.
The most common failure here is headlines that describe the company rather than addressing the visitor’s problem. “We help businesses grow” is a company statement. “Book more qualified demos without increasing ad spend” is a visitor-relevant statement. The difference in conversion rate between these two is not a UX decision. It is a message-market fit decision, and it is the highest-leverage change most landing pages can make.
3. Form length calibration
The relationship between form length and conversion rate is not linear, and teams that treat it as if it is will optimize themselves into a corner. HubSpot’s benchmark data across thousands of forms found that reducing a form from four fields to three increased conversions by roughly 50%. But forms with fewer than three fields often generate lower-quality leads that convert worse downstream.
The correct optimization is not to minimize fields but to match form length to the commitment level the offer justifies. A whitepaper download justifies two or three fields. A product demo request justifies five or six. A high-ACV enterprise trial request justifies eight or more. When a short form is placed against a high-commitment offer, you get high form completions and low downstream conversion.
Where “CRO” destroys UX without visibly hurting conversion rates
Some standard CRO tactics improve conversion rate metrics while creating UX damage that is harder to observe directly. These show up in downstream metrics: lower trial-to-paid rates, higher sales cycle friction, more customer support load, higher early churn.
1. Urgency without truth
Countdown timers and artificial scarcity are documented conversion rate lifts in A/B tests. They work because they trigger loss aversion, which is a real cognitive mechanism. They also destroy trust among the segment of visitors who return later, see the same countdown reset, and understand they were manipulated. For brands operating in high-consideration B2B markets, this destroys pipeline quality. For e-commerce brands with repeat purchase models, it erodes customer LTV.
2. Removing navigation to force decisions
Removing header navigation from landing pages is standard CRO practice, and it does reduce distraction for visitors who are ready to convert. The problem is that it removes an escape route for visitors who are not ready, creating a feeling of entrapment. The result is higher bounce rates combined with higher conversion rates, which looks good in isolation but may represent visitors who would have converted later after exploring more of the site if given the option.
3. Auto-advancing forms and qualification flows
Multi-step forms and qualification flows consistently outperform single-step forms in controlled tests. The mechanism is commitment bias: each micro-action increases the psychological investment in completing the sequence. The UX damage occurs when the flow is designed primarily for conversion and not for the visitor’s actual decision-making process. A five-step flow that asks for name, company size, and use case feels natural. A five-step flow that collects contact information incrementally feels like a funnel trap. The design looks identical from a conversion test perspective; the visitor experience is meaningfully different.
Intent-stage matching: the highest-leverage variable
The single most underused variable in landing page optimization is the visitor’s intent stage. Most landing pages are designed for one archetypal visitor and served to visitors across all stages of the buying journey.
A visitor arriving via a branded search query for “[product name] pricing” is at decision stage. They need specific pricing, comparison information, and a frictionless path to a demo or trial. A visitor arriving from a top-of-funnel content piece via a display ad is at awareness stage. They need education, relevance, and a low-commitment next step.
The same landing page served to both will underperform for both. For the decision-stage visitor, too much educational content creates noise and delays action. For the awareness-stage visitor, a direct “Book a demo” CTA is premature and feels aggressive.
The B2B customer journey averages 27 touchpoints before a decision according to Gartner research. Each touchpoint is an opportunity to match content to stage. Landing pages that do this correctly, showing educational content to early-stage visitors and conversion-focused content to late-stage visitors, consistently report 20 to 40% conversion rate improvement over single-variant pages.
The two approaches to implement this are:
- Traffic segmentation by source: Build separate landing page variants for different acquisition channels and keyword intents. A paid search landing page targeting “best CRM for small business” serves consideration-stage visitors. A landing page targeting “[competitor] alternative” serves decision-stage visitors. These require different headlines, different social proof formats, and different CTAs.
- Behavioral personalization: Use on-page behavioral signals (scroll depth, time on page, pages visited previously, interaction patterns) to adapt the page experience dynamically. This is more technically demanding but handles the variance within traffic sources that source-based segmentation cannot address.
CTA architecture: the mechanics of one clear goal
Research on conversion rates by Unbounce found that landing pages with a single CTA converted at 13.5% on average, versus 11.9% for pages with two to four CTAs. This is not a dramatic difference, but it compounds significantly at scale. The more meaningful finding was about CTA placement: pages where the primary CTA appeared above the fold and again after the primary value proposition converted consistently higher than pages where the CTA appeared only at the top or only at the bottom.
The practical principle is that a CTA should not be the beginning of the persuasion process. It should be the end of it. The page’s job is to answer the visitor’s implicit questions in the order they have them, and the CTA should appear at the moment each question set has been addressed. For a short landing page, this means above the fold after the headline and once more after social proof. For a longer landing page, it means after the hero section, after the benefit section, and after testimonials.
CTA copy specificity matters more than most teams realize. “Get started” converts worse than “Start my free trial.” “Learn more” converts worse than “See how it works.” The mechanism is expectation clarity: specific CTA copy tells the visitor exactly what clicking will cause, which reduces hesitation. The visitor who does not know what will happen after clicking often does not click.
Behavioral data over assumptions: reading what visitors actually do
Most landing page optimization decisions are made based on assumptions about visitor intent rather than observations of visitor behavior. The tools to change this are now accessible and do not require significant engineering: heatmapping, session recording, and funnel analytics can all be implemented with a single tag.
The four behavioral signals with the highest diagnostic value for landing pages:
- Rage clicks: Clicking repeatedly on a non-interactive element indicates the visitor expected that element to do something (typically navigate somewhere or expand content). A rage click cluster on a product image is telling you visitors want more product detail. That is a conversion opportunity being missed.
- Scroll depth: If 40% of visitors scroll past the fold but only 10% reach the CTA, the page has a content engagement problem between those two points. If the CTA is above the fold but scroll depth shows most visitors scrolling past it, the CTA is either visually weak or appearing too early, before the visitor has been given enough reason to act.
- Form field abandonment: Session recording tools that capture form interaction show exactly which fields cause abandonment. A phone number field causes abandonment at significantly higher rates than an email field in B2B contexts. This finding shows up consistently in heatmap data and gets ignored when teams do not have access to field-level analytics.
- Exit patterns by scroll depth: Visitors who exit from the top of the page have a message-market fit problem. Visitors who exit from the middle of the page have a content engagement problem. Visitors who exit from the bottom of the page without converting have a CTA or trust problem. These require different interventions.
How Pathmonk helps you convert more from the same landing page traffic
The core landing page optimization challenge is not knowing what to change. It is that a single page variant cannot serve all visitors optimally. Pathmonk addresses this by introducing a behavioral intelligence and microexperience layer that adapts to each visitor without requiring separate landing page builds or developer work.
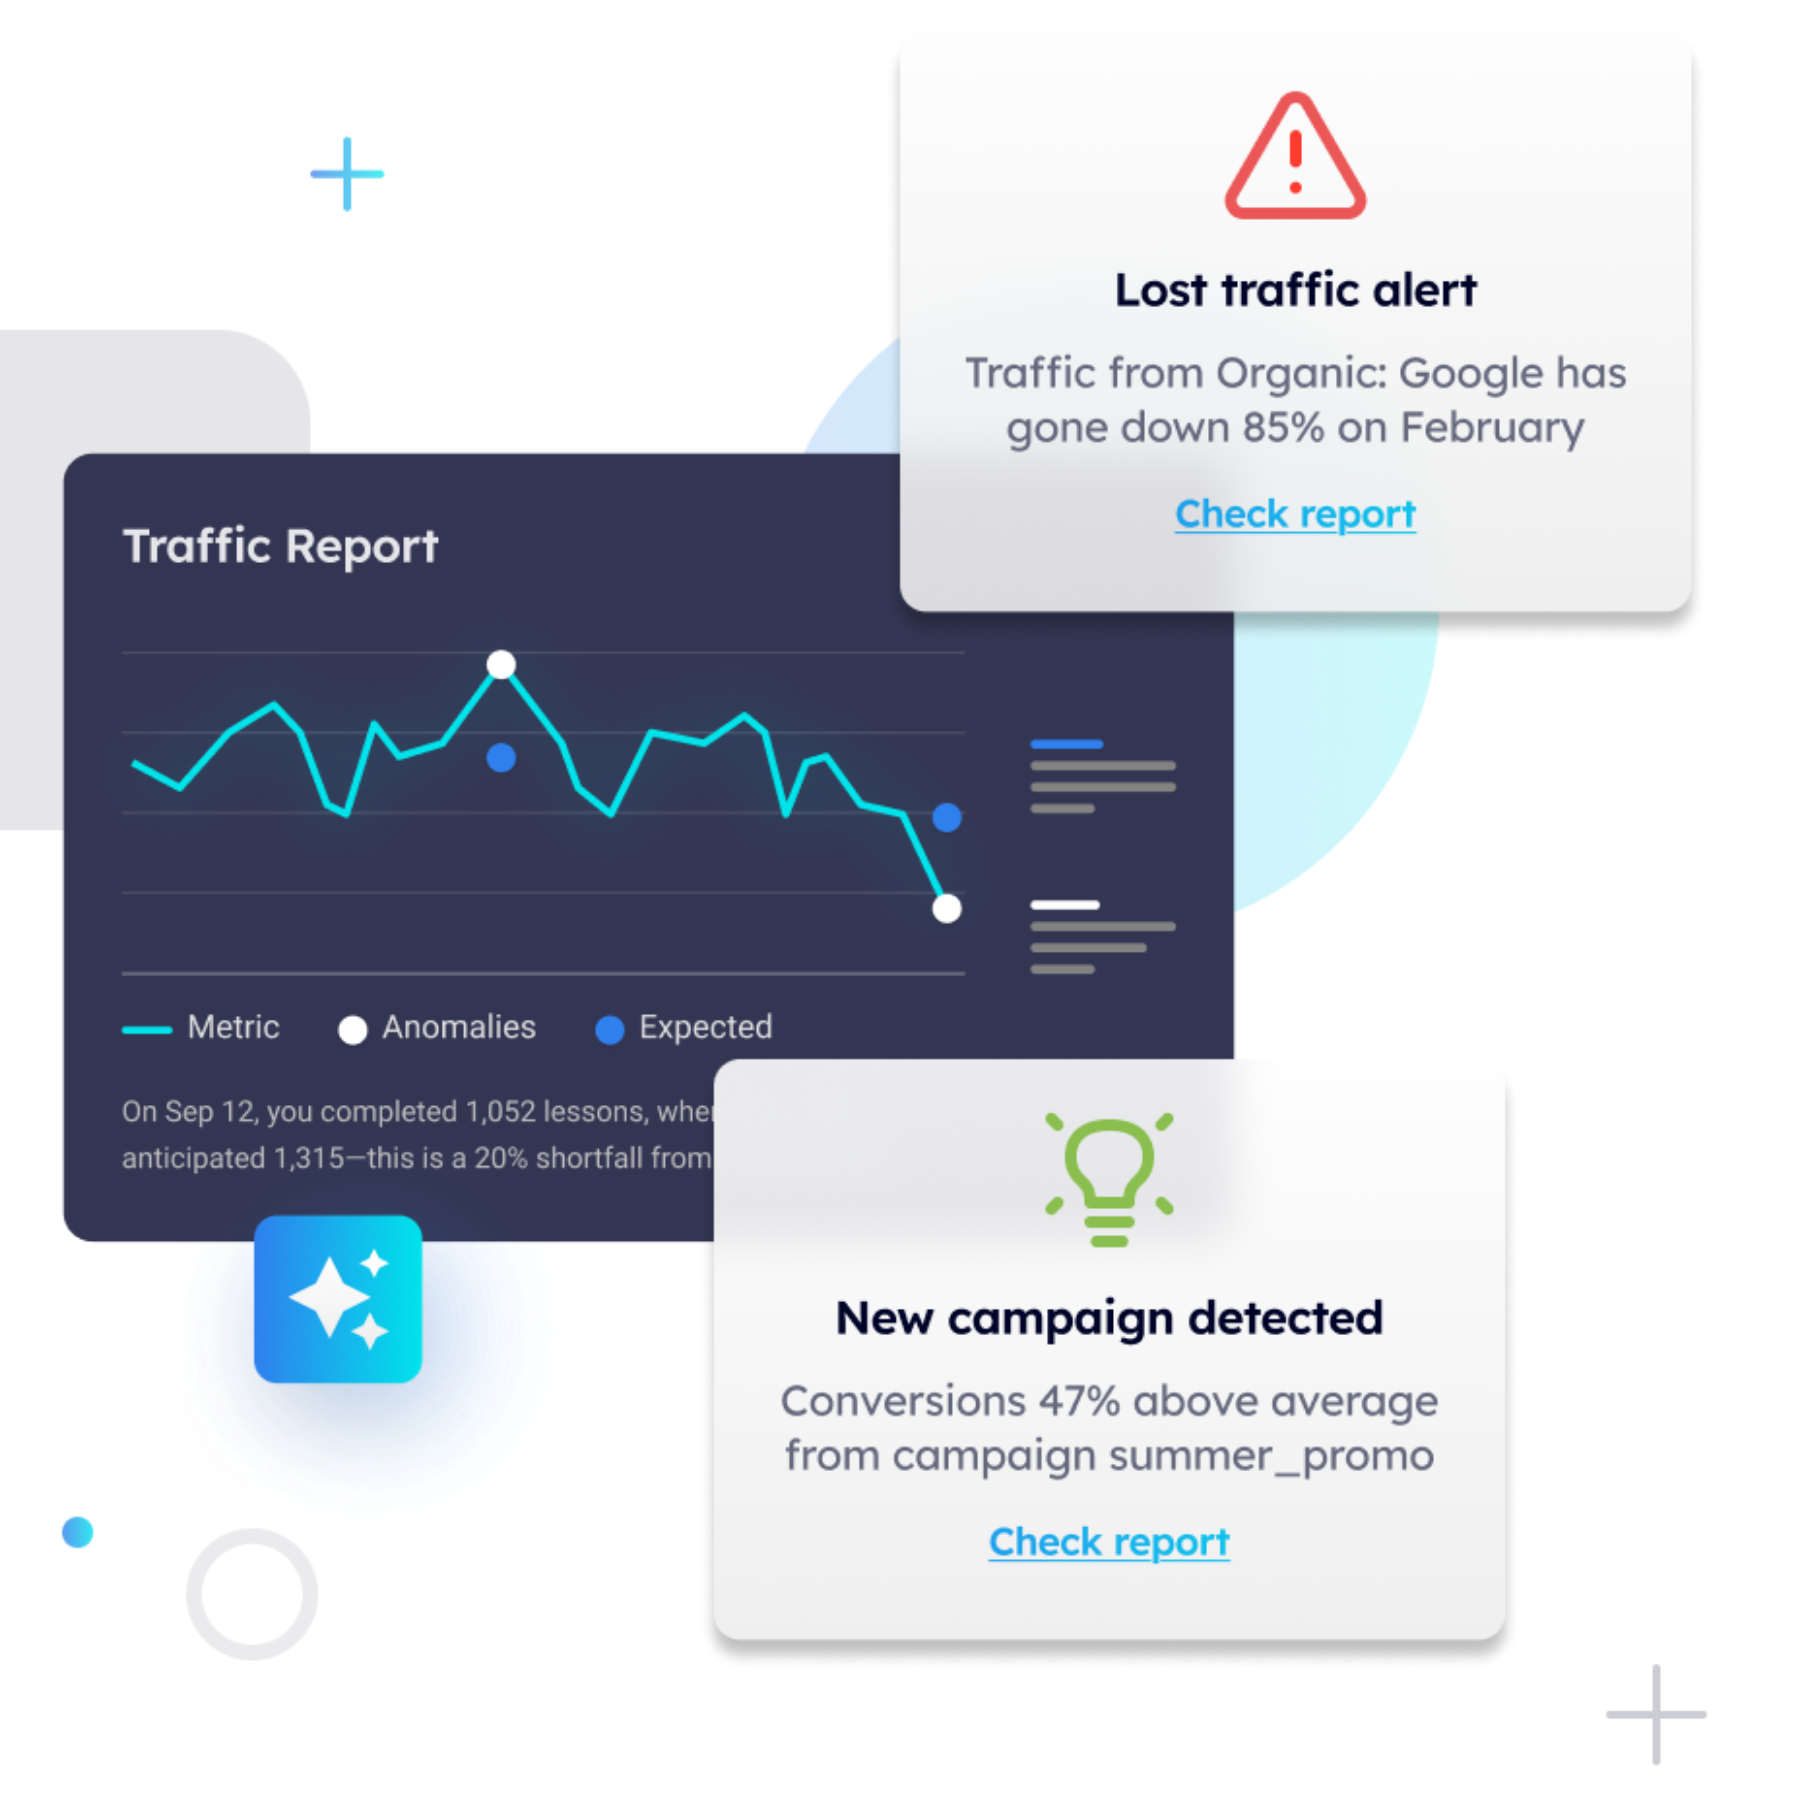
Intent classification is Pathmonk’s starting point. Using cookieless fingerprinting technology, Pathmonk assigns each visitor to a buying journey stage (awareness, consideration, or decision) based on behavioral signals: pages visited, scroll depth, interaction patterns, session history, and referral source. This stage detection happens in real time and updates as the visitor’s behavior evolves within the session.
Microexperiences are the mechanism through which Pathmonk acts on this classification. A microexperience is a small, contextually triggered interaction (a personalized message, an offer, a qualification flow, a content recommendation) that surfaces at the right moment based on where the visitor is in their journey. A decision-stage visitor on a pricing page sees a frictionless demo booking flow. A consideration-stage visitor on a features page sees a comparison guide or a social proof element matched to their apparent use case. An awareness-stage visitor who scrolls 70% of a blog post and pauses sees a content upgrade offer rather than a hard demo push.
Calculate your increased profit in just a few clicks
Easily find out how many conversions and revenue you can expect once Pathmonk is installed on your website.
Calculate your gains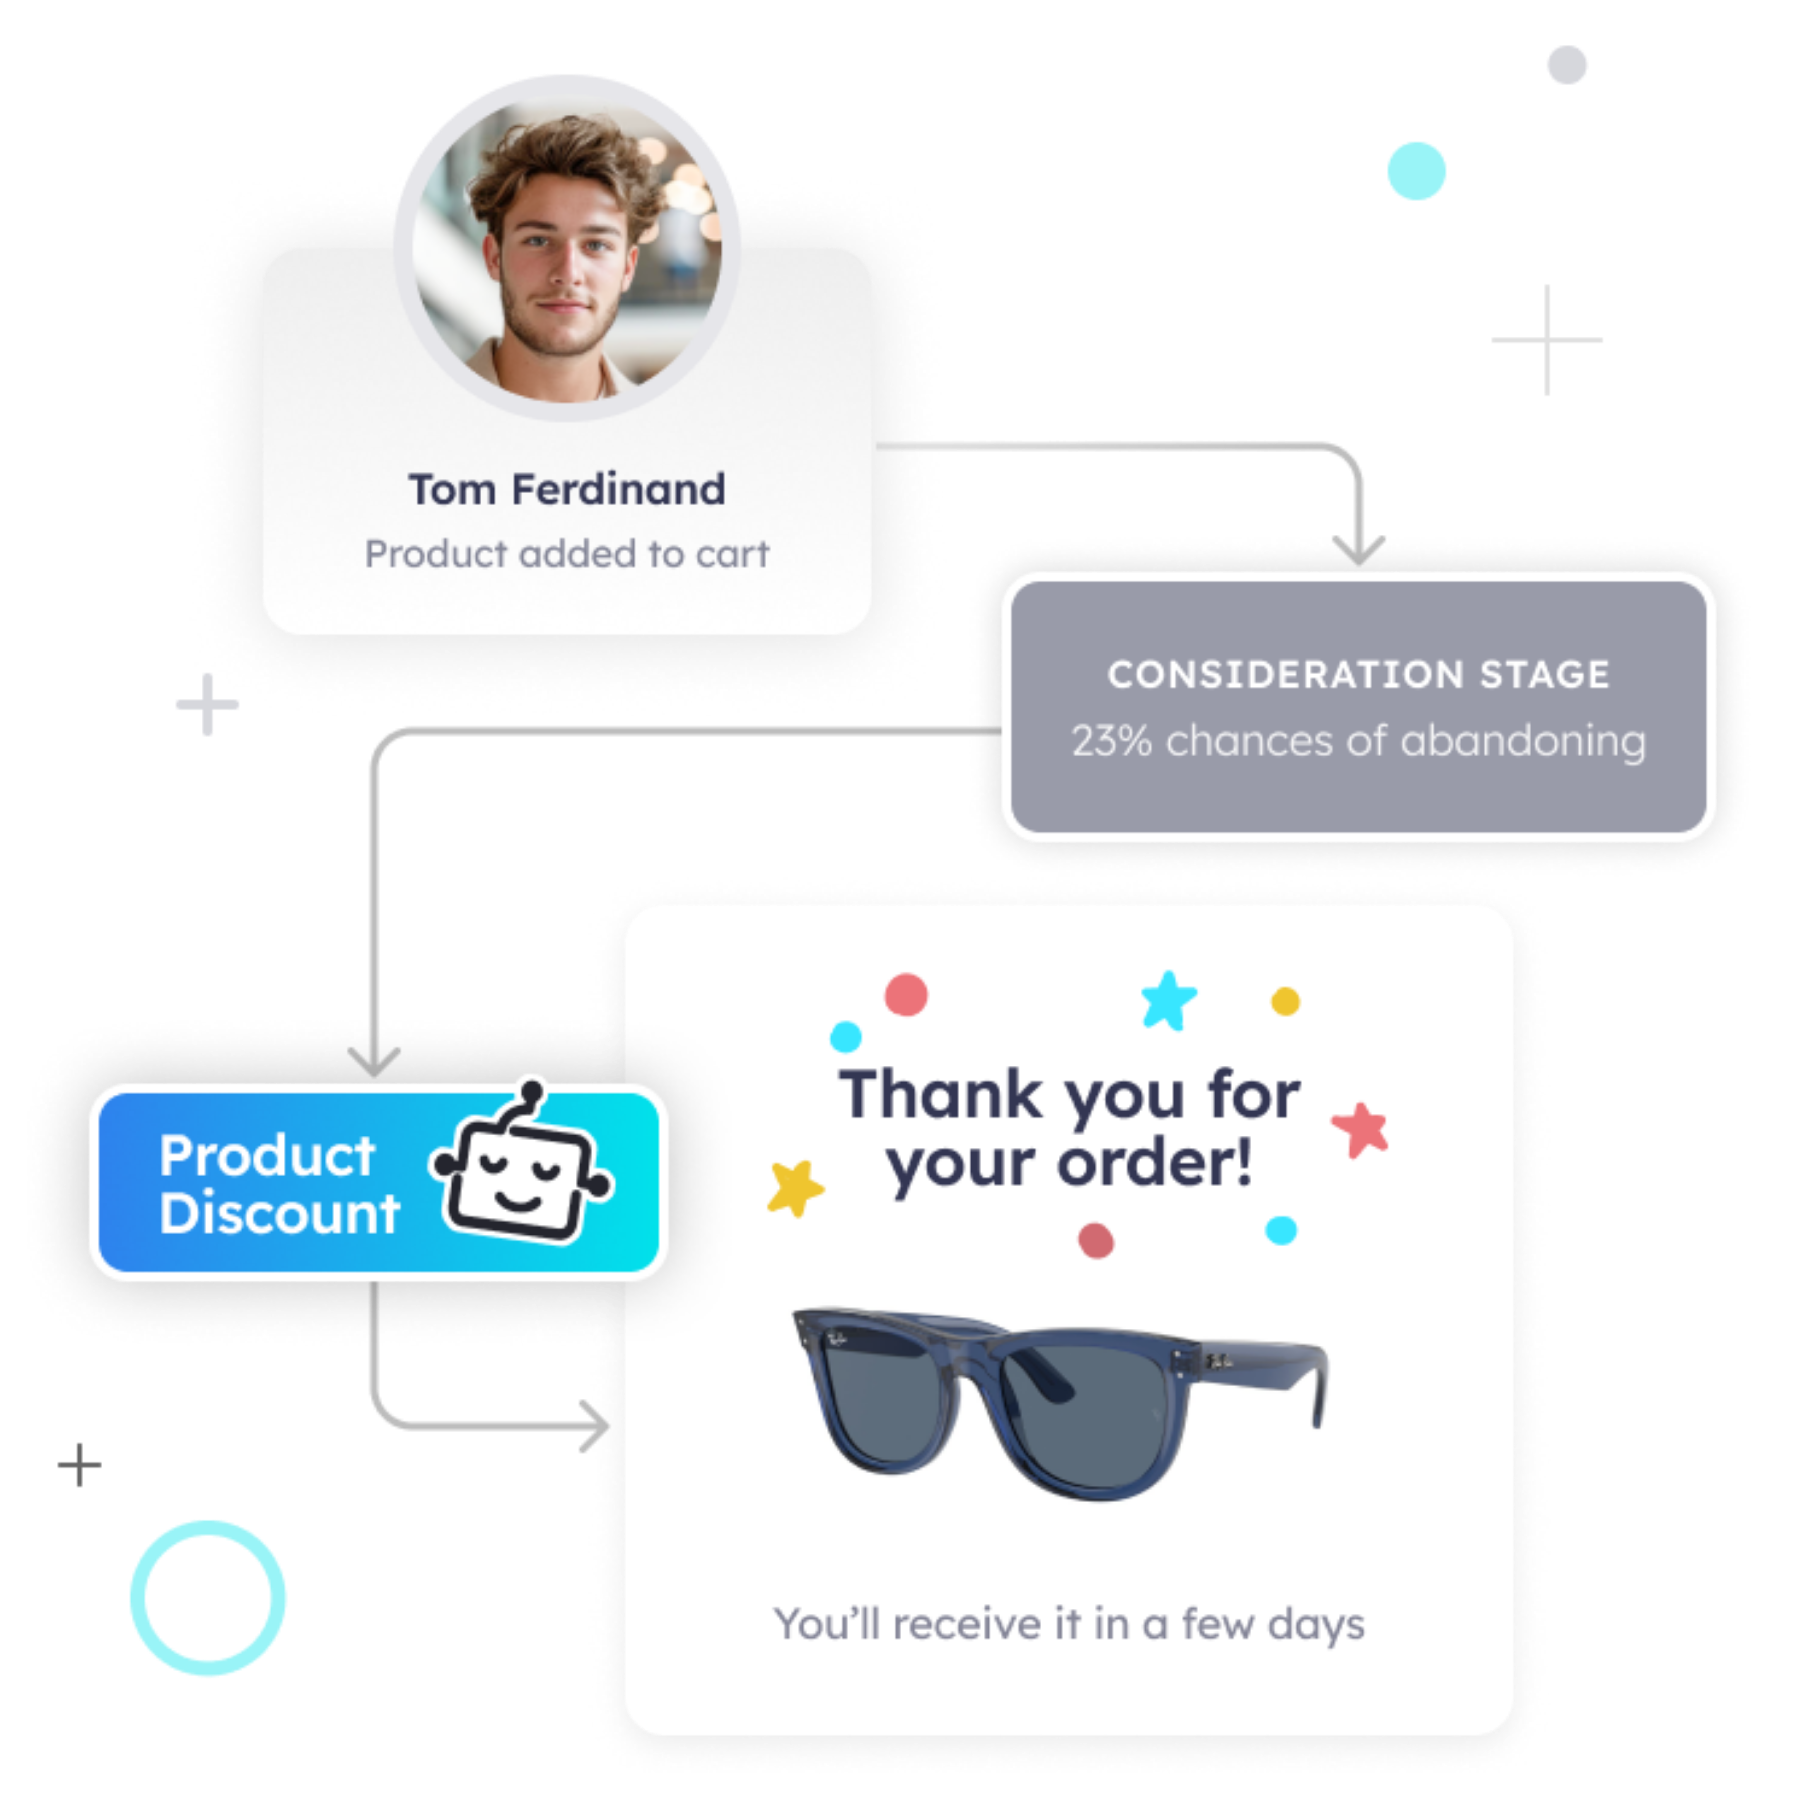
The business math is straightforward: a landing page receiving 10,000 monthly visitors at a 2% conversion rate produces 200 conversions. If intent-matched microexperiences improve that rate to 2.8% (a 40% uplift within the range Pathmonk’s guarantee covers), the output is 280 conversions from the same traffic. At a $200 CPL on the paid side, that is $16,000 per month in avoided acquisition spend for the same pipeline volume.
Self-optimization compounds these gains over time. Pathmonk runs a persistent 50/50 A/B test between the personalized experience and a control group, and the AI uses this data to refine microexperience targeting, adjusting which triggers, messages, and CTAs surface for which behavioral profiles. Best practices for high-converting microexperiences are built into the platform’s defaults, but teams can customize every element of copy, design, and trigger logic. Pathmonk operates entirely without cookies. Its fingerprinting model builds visitor identity from non-personally-identifiable signals, making it compliant by default in GDPR and CCPA contexts where consent-based tracking is constrained.
How Doctoralia increased demo conversions by 82% across three markets in two weeks
Doctoralia is one of the world’s leading healthcare appointment platforms, operating in multiple countries and serving both healthcare providers (B2B) and patients (B2C). Their marketing team needed to improve conversion rates on landing pages targeting healthcare clinics and private practices, without rebuilding those pages or increasing media spend.
Doctoralia’s landing pages were designed for a generalized visitor. The same page variant was being served to every visitor, regardless of their specialties, practice sizes, and stages of the decision process. Conversion rates were consistent but flat, a sign of a page that was working adequately for no one in particular.
Pathmonk was deployed across Doctoralia’s key landing pages in three markets. The platform’s intent classification identified visitor stage from behavioral signals, and microexperiences were configured to serve different levels of intent, social proof formats, and content elements based on the detected profile.
High-intent visitors (those who had visited multiple pages or were arriving via branded search) were shown a streamlined demo booking flow. Early-stage visitors were shown relevant case studies from clinics similar to their detected profile, lowering the perceived commitment of the first step.
Across the three markets in the first two weeks, Doctoralia recorded an average 82% increase in conversion rate. The result was attributed specifically to the intent-matching layer: the same traffic, the same page infrastructure, the same CTA language, but with a personalization layer that made each interaction feel relevant to the specific visitor rather than generic to the category.
FAQs on landing page optimization
Does removing form fields always improve conversion rate?
Reducing fields reliably increases form completions, but the relationship between completions and qualified conversions is inverse beyond a point. A one-field form (email only) will produce maximum completions and minimum qualification. The correct question is not “how few fields can we use?” but “what is the minimum information needed to route this lead appropriately?” For most B2B contexts, that is three to five fields.
What is the relationship between page speed and conversion rate on B2B landing pages?
The most cited research (Google/Deloitte, 2019) is primarily e-commerce focused, but B2B data from Portent shows that landing pages loading in one second convert at nearly three times the rate of pages loading in five seconds. The mechanism is expectation calibration: a slow page signals poor product quality to a sophisticated buyer. For B2B landing pages, target a Time to First Contentful Paint under 1.5 seconds and a Largest Contentful Paint under 2.5 seconds.
How do you know whether a low conversion rate is a traffic quality problem or a page problem?
Segment conversion rate by traffic source. If paid search converts at 4% and organic social converts at 0.8%, the problem is likely traffic quality or message-market fit at the acquisition layer, not the page itself. If all traffic sources convert below industry benchmark by a similar margin, the problem is almost certainly the page. Session recordings of non-converting visitors will show you whether they are abandoning early (message fit), mid-page (content engagement), or late (trust or CTA).
Should you use video on a landing page?
Video on landing pages shows mixed results. Wistia’s data shows that videos under 90 seconds are watched completely by 59% of viewers; videos over two minutes are completed by fewer than 25%. A demo video above the fold with autoplay muted can increase time on page and reduce bounce, but adds load weight and can distract from the CTA. The safest implementation is a thumbnail-gated video below the hero section, ensuring it does not delay the initial page render.
What is the correct A/B testing sequence for landing page optimization?
Test in this order: headline and subheadline (highest variance, fastest signal), CTA copy and placement, social proof format and position, form length, page structure (hero layout, section order). Do not test design elements before message elements. A beautiful page with a weak headline will still underperform. Most teams reverse this order because design changes are easier to brief than copywriting changes.
When does personalization hurt landing page conversion?
Personalization hurts when it feels presumptuous or incorrect. Geo-targeting that gets the city wrong, firmographic targeting that uses stale company data, or behavioral targeting that misclassifies intent stage all create a worse experience than a well-written generic page. The failure mode is treating personalization as a feature rather than as accuracy. Personalization that is correct raises conversion rates; personalization that is wrong lowers trust.
How do multi-step forms affect qualified lead rate versus single-step forms?
Multi-step forms with progressive disclosure consistently generate higher form completion rates (30 to 50% higher in controlled tests) but tend to produce slightly lower-quality leads because the commitment bias mechanism works on all visitors, including those who are not a strong fit. For products with short sales cycles and self-serve elements, multi-step forms are clearly positive. For high-ACV enterprise products with long qualification processes, a single longer form with explicit qualification criteria will filter more accurately at the top.
Does adding social proof always improve conversion rate?
Social proof improves conversion rate when it is specific, credible, and relevant to the visitor’s context. Generic five-star ratings with no company name or use case context add minimal lift. A testimonial from a company the visitor can identify with, describing a specific outcome, can add 10 to 20% conversion lift. Social proof that does not match the visitor’s industry or company size can actually lower trust by implying the product is not designed for them.
Increase +180% conversions from your website with AI
Get more conversions from your existing traffic by delivering personalized experiences in real time.
- Adapt your website to each visitor’s intent automatically
- Increase conversions without redesigns or dev work
- Turn anonymous traffic into revenue at scale

Key takeaways
- The conversion-UX tension is a measurement problem, not a real tradeoff. Mechanical friction reduction improves both UX and conversions; removing cognitive and trust signals improves conversion metrics while damaging downstream funnel health.
- Page load speed is the single optimization with zero downside: it improves UX and conversion rate simultaneously, and is almost never prioritized correctly.
- Form length optimization should target the minimum fields needed for qualification, not the minimum fields possible. The right number depends on the offer’s commitment level and the downstream qualification process.
- Intent-stage matching (showing different content or CTAs to visitors at different stages of the buying journey) consistently delivers 20 to 40% conversion improvement over single-variant pages, with no UX degradation.
- CTA copy specificity matters: “Start my free trial” outperforms “Get started” because it reduces hesitation by setting accurate expectations.
- Behavioral data (heatmaps, scroll depth, form field abandonment, exit patterns) is the most reliable diagnostic tool for identifying which type of friction is causing conversion loss, and it segments the problem in a way that traffic-level analytics cannot.
- Urgency tactics (countdown timers, artificial scarcity) produce measurable short-term conversion lifts and measurable long-term trust damage in high-consideration markets. The tradeoff is worth measuring before assuming it is net positive.
- Behavioral personalization at the intent stage level, matched to behavioral signals rather than demographic proxies, produces the most durable conversion gains without requiring page rebuilds or additional ad spend.