

Intent Distribution
Why mobile converts less — it's a cohort problem, not just a UX problem
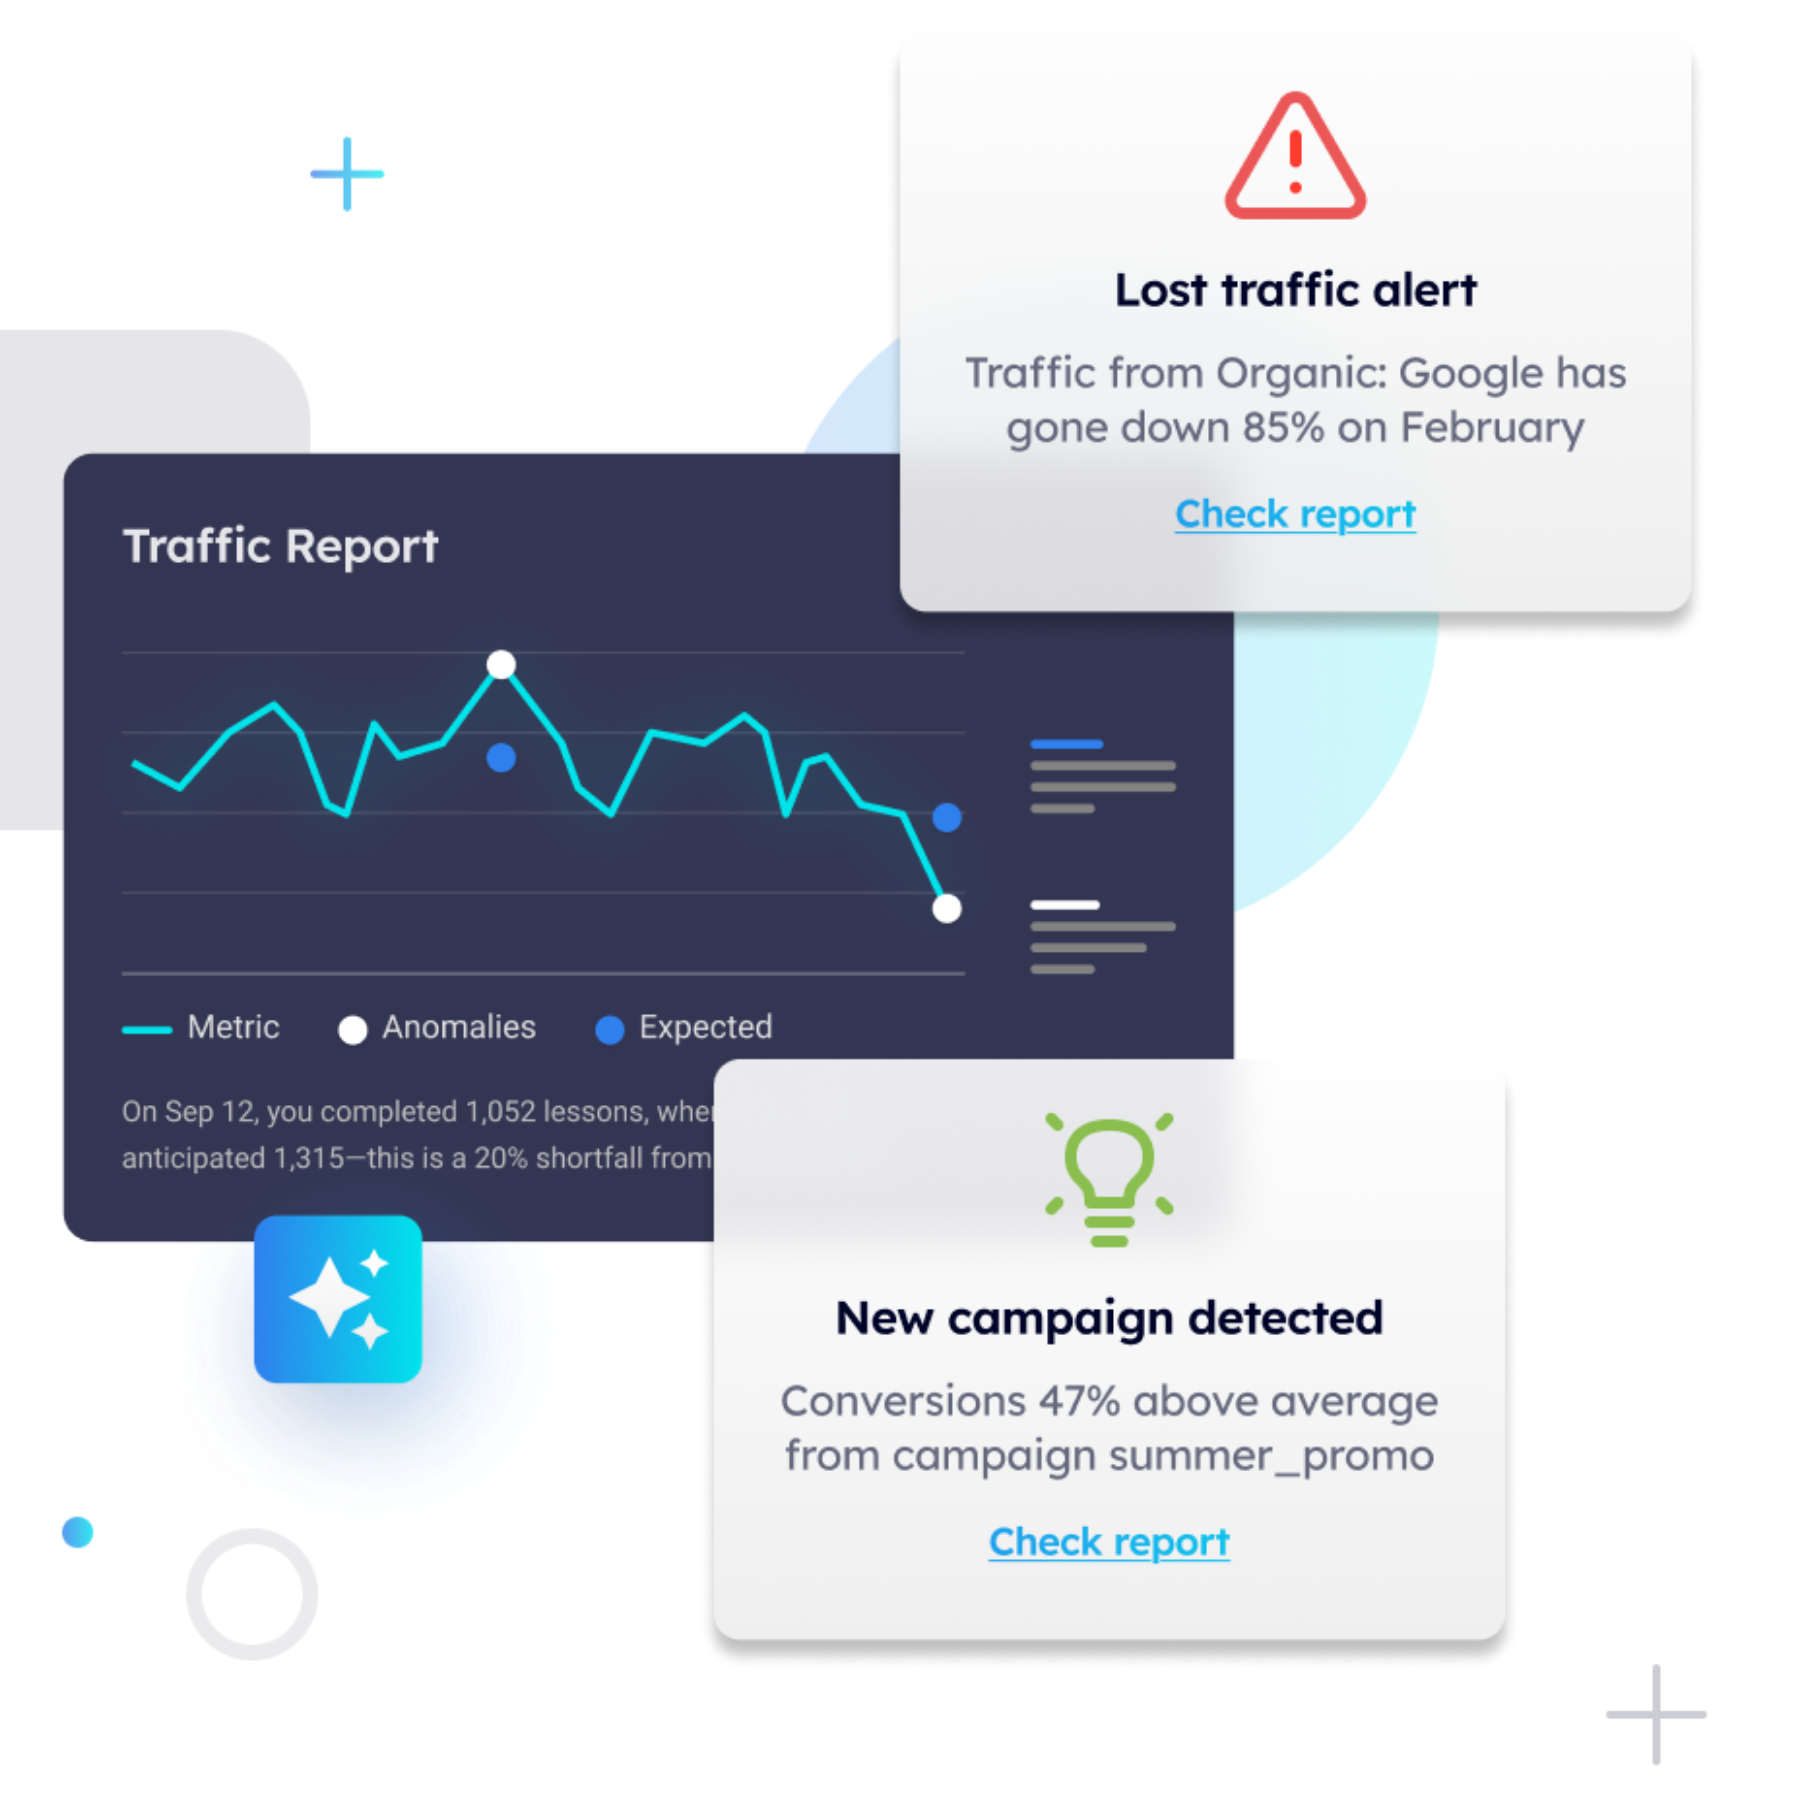
Distribution of visitor intent stages across device + traffic source — same conversion rate benchmark applied to all
Awareness — browsing, no purchase intent
Consideration — evaluating options
Decision — ready to convert
5.8%
CVR
4.2%
CVR
1.9%
CVR
0.4%
CVR
What this means for desktop
Desktop direct visitors have 57% decision-stage intent. Your primary CTA and full-friction form are well-matched to this cohort. Optimizing for desktop is largely a UX problem.
What this means for mobile
Mobile paid social has 72% awareness-stage visitors. Showing them a purchase CTA is a message-to-intent mismatch. The fix is offer architecture, not button size.
Common mistake: Applying the same conversion rate benchmark to all four cohorts. A mobile paid social CVR of 0.4% may be appropriate given the intent distribution — while a mobile organic CVR of 1.9% may signal a real UX problem worth fixing. Segment before you diagnose.
Attribution Accuracy
The 7-day mobile journey where tracking silently breaks
A single user, one purchase decision — and three places where standard analytics loses the thread on mobile
First visit
Day 0
ITP reset
Day 1
Return visit
Day 2
Session gap
Day 4
Desktop convert
Day 7
Day 0
First mobile visit via Instagram ad
Tracked
User arrives on mobile, browses product page, exits without converting. Cookie set by JS tag.
GA4 reads:
New visitor · Mobile · Paid Social
Day 1
Safari ITP deletes the JS-set cookie
Silent loss
After 24 hours, Safari ITP expires the script-set first-party cookie. The user's identity is erased from the browser. No error is thrown. No event fires.
GA4 reads:
Nothing — gap in data
Day 2
User returns to site via email click
Misidentified
User clicks email link and revisits. Because the cookie expired, GA4 creates a new session with a new client ID. The prior visit is not connected.
GA4 reads:
New visitor · Mobile · Email (wrong)
Day 4
User switches apps mid-session (35 min gap)
Session split
User opens the site, takes a call, returns 35 minutes later. GA4's default 30-min timeout ends the first session and starts a second. One visit becomes two.
GA4 reads:
2 sessions · 2× pageviews · inflated bounce
Day 7
User converts on desktop
Mobile gets no credit
User opens laptop, searches brand name, lands on site, and completes purchase. Desktop organic search gets 100% of conversion credit. Mobile's 3 touchpoints are invisible.
GA4 reads:
Desktop · Organic · Last-click conversion
What this distorts in your reporting
↑ 23%
New visitor inflation
ITP cookie resets inflate new visitor counts on mobile, making returning visitor CVR appear lower than it is
2×
Session count inflation
30-min session timeout splits app-switching behavior into multiple sessions, inflating bounce rate and page-depth averages
0%
Mobile attribution
Cross-device journeys leave mobile with zero conversion credit, undervaluing the channel in budget decisions
Fix ITP: server-side tagging
Set cookies via HTTP headers, not JS. Server-set first-party cookies persist for your specified duration, surviving ITP's script-set expiry rules.
Fix cross-device: GA4 User-ID
Implement User-ID for logged-in sessions. Stitch mobile and desktop into a single user journey. Extend session timeout to 60 minutes minimum.
Diagnostic Framework
Where the mobile funnel diverges from desktop
Conversion drop-off at each funnel step — same site, same offer, different device
Desktop
Intentional, task-oriented sessions
Mobile
Fragmented, browse-mode sessions
Landing page
✓ Strong entry
Scroll depth
✓ CTA visible
CTA click
✓ Healthy CTR
Form start
✓ Low friction
Form completion
↓ Some drop here
1
2
3
4
5
Landing page
✗ Major drop
Scroll depth
✗ CTA missed
CTA click
✗ Trust gap
Form start
↓ Friction starts
Form completion
✗ Critical failure
Overall conversion rate
Desktop visitors → converted
4.2%
Overall conversion rate
Mobile visitors → converted
0.8%
5.25× conversion gap — but the gap isn't uniform across steps. Mobile loses most of its traffic at steps 1–2 (bounce + scroll), not at the form. Fixing the form before fixing bounce rate is the most common misdiagnosis in mobile CRO.
Form Friction Analysis
Same form. 4× more friction on mobile.
Time cost per field — identical 5-field form, different device. Bar height = seconds (max 30s).
First name
Email
Phone + country
Company
Find & submit
Desktop
Mobile
Mobile ÷ Desktop
2×
3×
4.7×
3.5×
9×
Desktop totalkeyboard + autofill
19s
Mobile totalkeyboard switching + autocorrect
78s
4.1×
Time multiplier
Before touching a single line of copy or design
Cross-Device Attribution
The journey GA4 cannot see
One user, one purchase decision, seven days — and what standard analytics actually records at each step
Mobile
Desktop
📱
Instagram ad
Day 0
🔍
Browses product
Day 0
🔄
Returns via email
Day 2
⏸️
Session drops
Day 4
⚡ ITP cookie reset
🖥️
Brand search
Day 7
🎯
Converts
Day 7
✓ GA4 credits this
Break 1 — ITP cookie expiry
After 24 hours, Safari deletes the JS-set cookie. The Day 2 return visit creates a new client ID — prior session is unlinked.
Break 2 — session fragmentation
User switches apps mid-session. GA4's 30-min timeout fires, splitting one visit into two sessions with inflated bounce rate.
Break 3 — cross-device blind spot
Desktop conversion credited 100% to organic search. 3 mobile touchpoints get zero credit — they're invisible in every attribution report.
✗ What GA4 reports
1 desktop session — organic search, last-click conversion
3 separate mobile sessions attributed to different sources, zero conversions
Mobile channel shows 0% conversion contribution to this purchase
Day 2 return visitor counted as new visitor due to ITP reset
✓ What actually happened
1 user, 7-day journey across 2 devices and 4 touchpoints
Mobile initiated awareness and drove the email re-engagement that kept intent warm
Desktop organic was a convenience close — not the channel that created intent
Fix: server-side tagging + GA4 User-ID stitches the full journey correctly