

A conversion drop is within normal range if it falls inside the statistical control limits for that metric, typically ±1.5 to 2 standard deviations from the trailing 30-day mean, with no corresponding change in segment composition, technical behavior, or site performance. It signals a real problem when the drop persists across three or more consecutive measurement periods, concentrates in one specific segment or funnel stage, or coincides with a measurable event such as a deployment, a traffic source shift, or a form change.
These two conditions are not equivalent and do not require the same CRO strategy. Random variance resolves without intervention. Structural problems compound until addressed. Conflating them is one of the most common ways CRO teams waste diagnostic cycles.
Table of Contents
A 2023 analysis by CXL Institute found that 61% of marketing teams investigated at least one conversion “crisis” per quarter that turned out to be normal statistical noise. Each false alarm consumed an average of 14 hours of analyst and developer time. The cost was not just the wasted hours; it was the opportunity cost of not investigating the drops that were real.
Conversion rate measurement has a fundamental problem: the metric is a ratio. Small movements in numerator and denominator can produce large percentage swings that look alarming but carry no statistical weight. A landing page converting at 3.8% one week and 3.1% the next has not necessarily broken. It may simply be operating inside its normal variance envelope.
What makes this harder is that the signals marketers typically monitor, weekly CR reports, GA4 dashboards, HubSpot pipeline snapshots, were not designed for anomaly detection. Different analytics types serve different purposes, and standard reporting tools report what happened. They do not tell you whether what happened is meaningful.
The question experienced practitioners need to answer is not “did the rate change?” but “did the process generating that rate change?” These are different questions, and they require different tools. This article builds a structured diagnostic framework called the Diagnosis Stack for separating signal from noise when a conversion metric moves.
Get your website’s conversion score in minutes
- Instant CRO performance score
- Friction and intent issues detected automatically
- Free report with clear next steps
What normal conversion variance actually looks like
Statistical process control, developed for manufacturing quality management in the 1920s, applies directly to conversion rate monitoring. The core principle: a process operating within its normal parameters will produce outputs that stay within control limits. Variation outside those limits indicates the process itself has changed, not just the output.
For conversion rates, the practical application is a control chart: plot daily or weekly conversion rate against upper and lower control limits set at ±2 standard deviations from the process mean.
The math is straightforward. For a conversion rate with mean p and n observations per period:
Standard deviation = √(p × (1 – p) / n)
UCL = p + 2σ LCL = p – 2σ
A page receiving 500 sessions per week and converting at 4% has a standard deviation of roughly 0.87 percentage points. Its expected range is 2.26% to 5.74% in any given week, purely from sample variation, with no underlying change. Many teams would trigger a panic investigation at a 3% reading that is statistically unremarkable.

Three factors inflate perceived variance beyond what the control chart predicts:
- Session volume. Lower traffic produces wider natural ranges. A page with 100 sessions per week has a natural weekly variance of 3.9 percentage points around a 4% mean. The same page at 5,000 sessions narrows that to 0.55 points. Teams running CRO on low-traffic pages should consult our guide on whether CRO is worth it for small sites with low traffic before interpreting any single period’s numbers.
- Measurement period. Week-over-week comparisons amplify noise from day-of-week effects, national holidays, and campaign burst patterns. 14-day rolling windows reduce noise by approximately 40% for most B2B SaaS sites without masking genuine trends.
- Form goal vs. downstream conversion. A “form submitted” goal has lower variance than “demo booked” or “trial converted.” Each conversion goal accumulates fewer data points and sits further from intent-to-action, so its natural variance is wider. Teams measuring form fills will reach statistical stability 3x faster than teams measuring qualified demos.
The four categories of conversion drops
Not all real drops have the same cause, and different causes require completely different interventions. Before running any diagnostic, categorize the drop by source:
1. Traffic composition shift. The conversion rate changes because the mix of traffic changed, not because the site’s ability to convert that traffic changed. A surge in branded direct traffic inflates CR; a new paid campaign targeting cold audiences deflates it. The site itself is functioning identically. This is the most common source of false-positive crisis investigations.Detection: segment by source/medium. If the drop disappears when you look at a single consistent channel (organic, for example), the issue is composition, not performance.
2. Technical breakage. A form stops firing its confirmation event. A JavaScript error blocks the CTA on specific devices. A GTM tag fires twice and inflates session counts. These produce sharp, sudden drops that typically coincide with a deployment and show up as a spike in the bot traffic report or a mismatch between form completions and CRM entries.Detection: check form submission events in real time against CRM records. A gap of more than 5% indicates a technical failure, not a behavioral one.
3. Behavioral shift. Visitors are reaching the conversion point but declining to act. This is the category most CRO investment is designed to address, but it is frequently misdiagnosed as categories 1 or 2. Behavioral signals accumulate in engagement metrics, scroll depth, time-on-page, click patterns, before they surface in conversion rate, and the drop is usually segment-specific rather than site-wide.
4. External market change. A competitor launches a product, a category enters a downturn, or macroeconomic pressure reduces purchase intent across the segment. These drops are real but not fixable through on-site optimization. Responding to category-level demand compression with CRO testing wastes resources.
When the drop is genuinely behavioral, the underlying causes are often more mundane than teams expect: friction in the form flow, mismatched messaging for the visitor’s stage, or a CTA that asks for too much commitment too early.
The Diagnosis Stack: a sequential framework for identifying the source
The Diagnosis Stack is a layered diagnostic sequence. Each layer eliminates one category of explanation before moving to the next. Running it out of order wastes time and produces false conclusions.
Layer 1: Statistical validity check
Before doing anything else, calculate whether the observed drop crosses the control limit threshold for your baseline and traffic volume. If it does not, stop. Log the observation and resume monitoring. Do not investigate noise.
Tools: any spreadsheet with the formula above, or a control chart plugin in Looker Studio.
Time cost: 5 minutes.
Layer 2: Technical integrity check
If the drop is statistically significant, check whether it could be explained by measurement failure before assuming behavior change. Verify:
- Conversion event firing rate (GA4 events vs. CRM entries)
- JavaScript error rate by browser and device
- Page load performance for the affected funnel steps (Core Web Vitals changes correlate with CR changes at a coefficient of approximately 0.3 for LCP and 0.4 for CLS)
- Tag Manager container version history aligned to the drop onset date
This layer takes 30-60 minutes and eliminates the most embarrassing diagnosis mistake: treating a broken pixel as a behavioral problem. Purpose-built CRO tools typically expose event firing gaps faster than manual GA4 auditing.
Layer 3: Segment isolation
Segment the drop by source, device, geography, new vs. returning visitors, and funnel stage. A real behavioral problem almost always concentrates. If the drop is uniform across every segment, it is more likely a technical issue you have not found yet or a market-level shift. If it concentrates in mobile Safari from paid social, you have a specific hypothesis to investigate.
The most useful segmentation sequence for most B2B SaaS funnels:
- By acquisition channel (organic search, paid search, paid social, direct, email)
- By device category
- By funnel stage (landing, pricing, demo request, for example)
- By visitor type (new vs. returning)
Stage-level segmentation often reveals the most actionable signal. A drop from landing page visit to pricing page view indicates a messaging or relevance problem. A drop from pricing page to demo request indicates a friction or trust problem. B2B funnels typically require more touchpoints to reach a decision than most teams account for in their funnel stage definitions. These require different interventions, and understanding where in the funnel the friction sits is a prerequisite for any remediation.
Layer 4: Temporal alignment
Map the drop onset against:
- Deployment calendar (code changes, form updates, CMS changes)
- Campaign changes (new ad creative, audience shifts, budget reallocation)
- External calendar events (quarter-end buying behavior, industry events, competitor announcements)
- Seasonal patterns from prior years
A drop that began within 48 hours of a deployment is almost certainly technical or copy-related. A drop that began 3-4 weeks ago and has gradually steepened is more likely behavioral. These require different urgency levels and different investigation resources.
Layer 5: Competitor and market context
If layers 1-4 do not isolate the cause, check whether the drop is specific to your site or reflects category-level movement. Methods:
- Google Trends for category keywords over the drop period
- Paid search impression share (declining impression share with stable budget suggests auction pressure from competitors)
- Industry benchmark reports, conversion rate benchmarks by industry provide useful baseline comparisons
If the category is declining, no amount of on-site optimization will recover the number. The correct response is repositioning or targeting a different demand segment, not CRO testing.
Segmentation as the primary diagnostic tool
The single most reliable indicator of whether a conversion drop is structural or noise is its distribution across segments. Random variance distributes roughly uniformly across segments; real problems concentrate.
A site-wide drop of 0.8 percentage points that, when segmented, turns out to be a 3.2 percentage point drop on mobile Chrome from paid search, with all other segments stable, is a specific problem with a specific likely cause. That same drop distributed uniformly across all sources and devices is probably noise, or a broad market shift.
The distribution test is simple: calculate the drop magnitude per segment and compute the coefficient of variation across segments. High CV (concentrated drop) points toward a specific cause. Low CV (uniform drop) points toward noise or external factors.
One common mistake here is stopping at top-level segmentation. Channel-level segments are too coarse to isolate most behavioral problems. The relevant segment for most B2B sites is traffic quality vs. website performance and that requires analyzing new visitor behavior by acquisition source at the funnel stage level, not just overall.
The segment that most consistently reveals genuine behavioral problems is first-visit organic search users reaching a key landing page. This segment has the most stable composition over time (search algorithms change slowly), the highest conversion intent signal, and the least susceptibility to campaign-level noise. If this segment’s conversion rate drops, something about the site’s ability to convert qualified demand has changed.
When the standard checks fail
Three situations break the standard diagnostic sequence:
- Low session volumes. Below 300 sessions per measurement period on the goal step, control limits widen to the point where only catastrophic drops cross the significance threshold. Most teams operate several pages in this range. The correct approach is to extend the measurement window (30 or 60 days instead of 7), use aggregate funnel metrics rather than per-page metrics, and establish leading indicators (scroll depth, time-on-page, CTA hover rate) that accumulate faster than conversion events. Running A/B tests at this volume requires a minimum sample size calculation before any conclusions are drawn, a mistake detailed in how statistical significance works in CRO testing.
- Multi-touch attribution distortions. If your conversion tracking counts the session at conversion rather than at intent, a shift in the number of touchpoints to conversion will change reported conversion rate without any change in actual persuasion effectiveness. A visitor who used to convert in one session now takes three sessions before converting. Session-based CR drops. Journey-based CR is flat. Attribution methodology matters more than most teams account for.
- Delayed conversion cycles. B2B SaaS with 30-90 day sales cycles will see current-period CR affected by decisions made months earlier. A quality drop in pipeline from Q1 SDR outreach shows up in Q2 demo-to-closed-won metrics, not in Q2 website CR. The metrics that matter for SaaS growth operate on different time horizons than web analytics, which makes direct period comparisons unreliable. Teams investigating funnel drops need to date-shift their segments to align traffic acquisition cohorts with conversion events, not calendar periods.
How Pathmonk recovers a conversion drop without touching your website
Most responses to a confirmed behavioral drop follow the same path: hypothesis, design change, developer ticket, QA, deploy, wait for data. The cycle takes weeks, and it assumes the diagnosis was correct in the first place. If it was not, you have spent a sprint fixing the wrong thing.
Pathmonk operates as an intelligent layer that runs on top of your existing website, without modifying your design, copy, or code. It installs via a single SDK snippet, requires no developer involvement after setup, and begins working on the conversion problem immediately, using the website as-is.
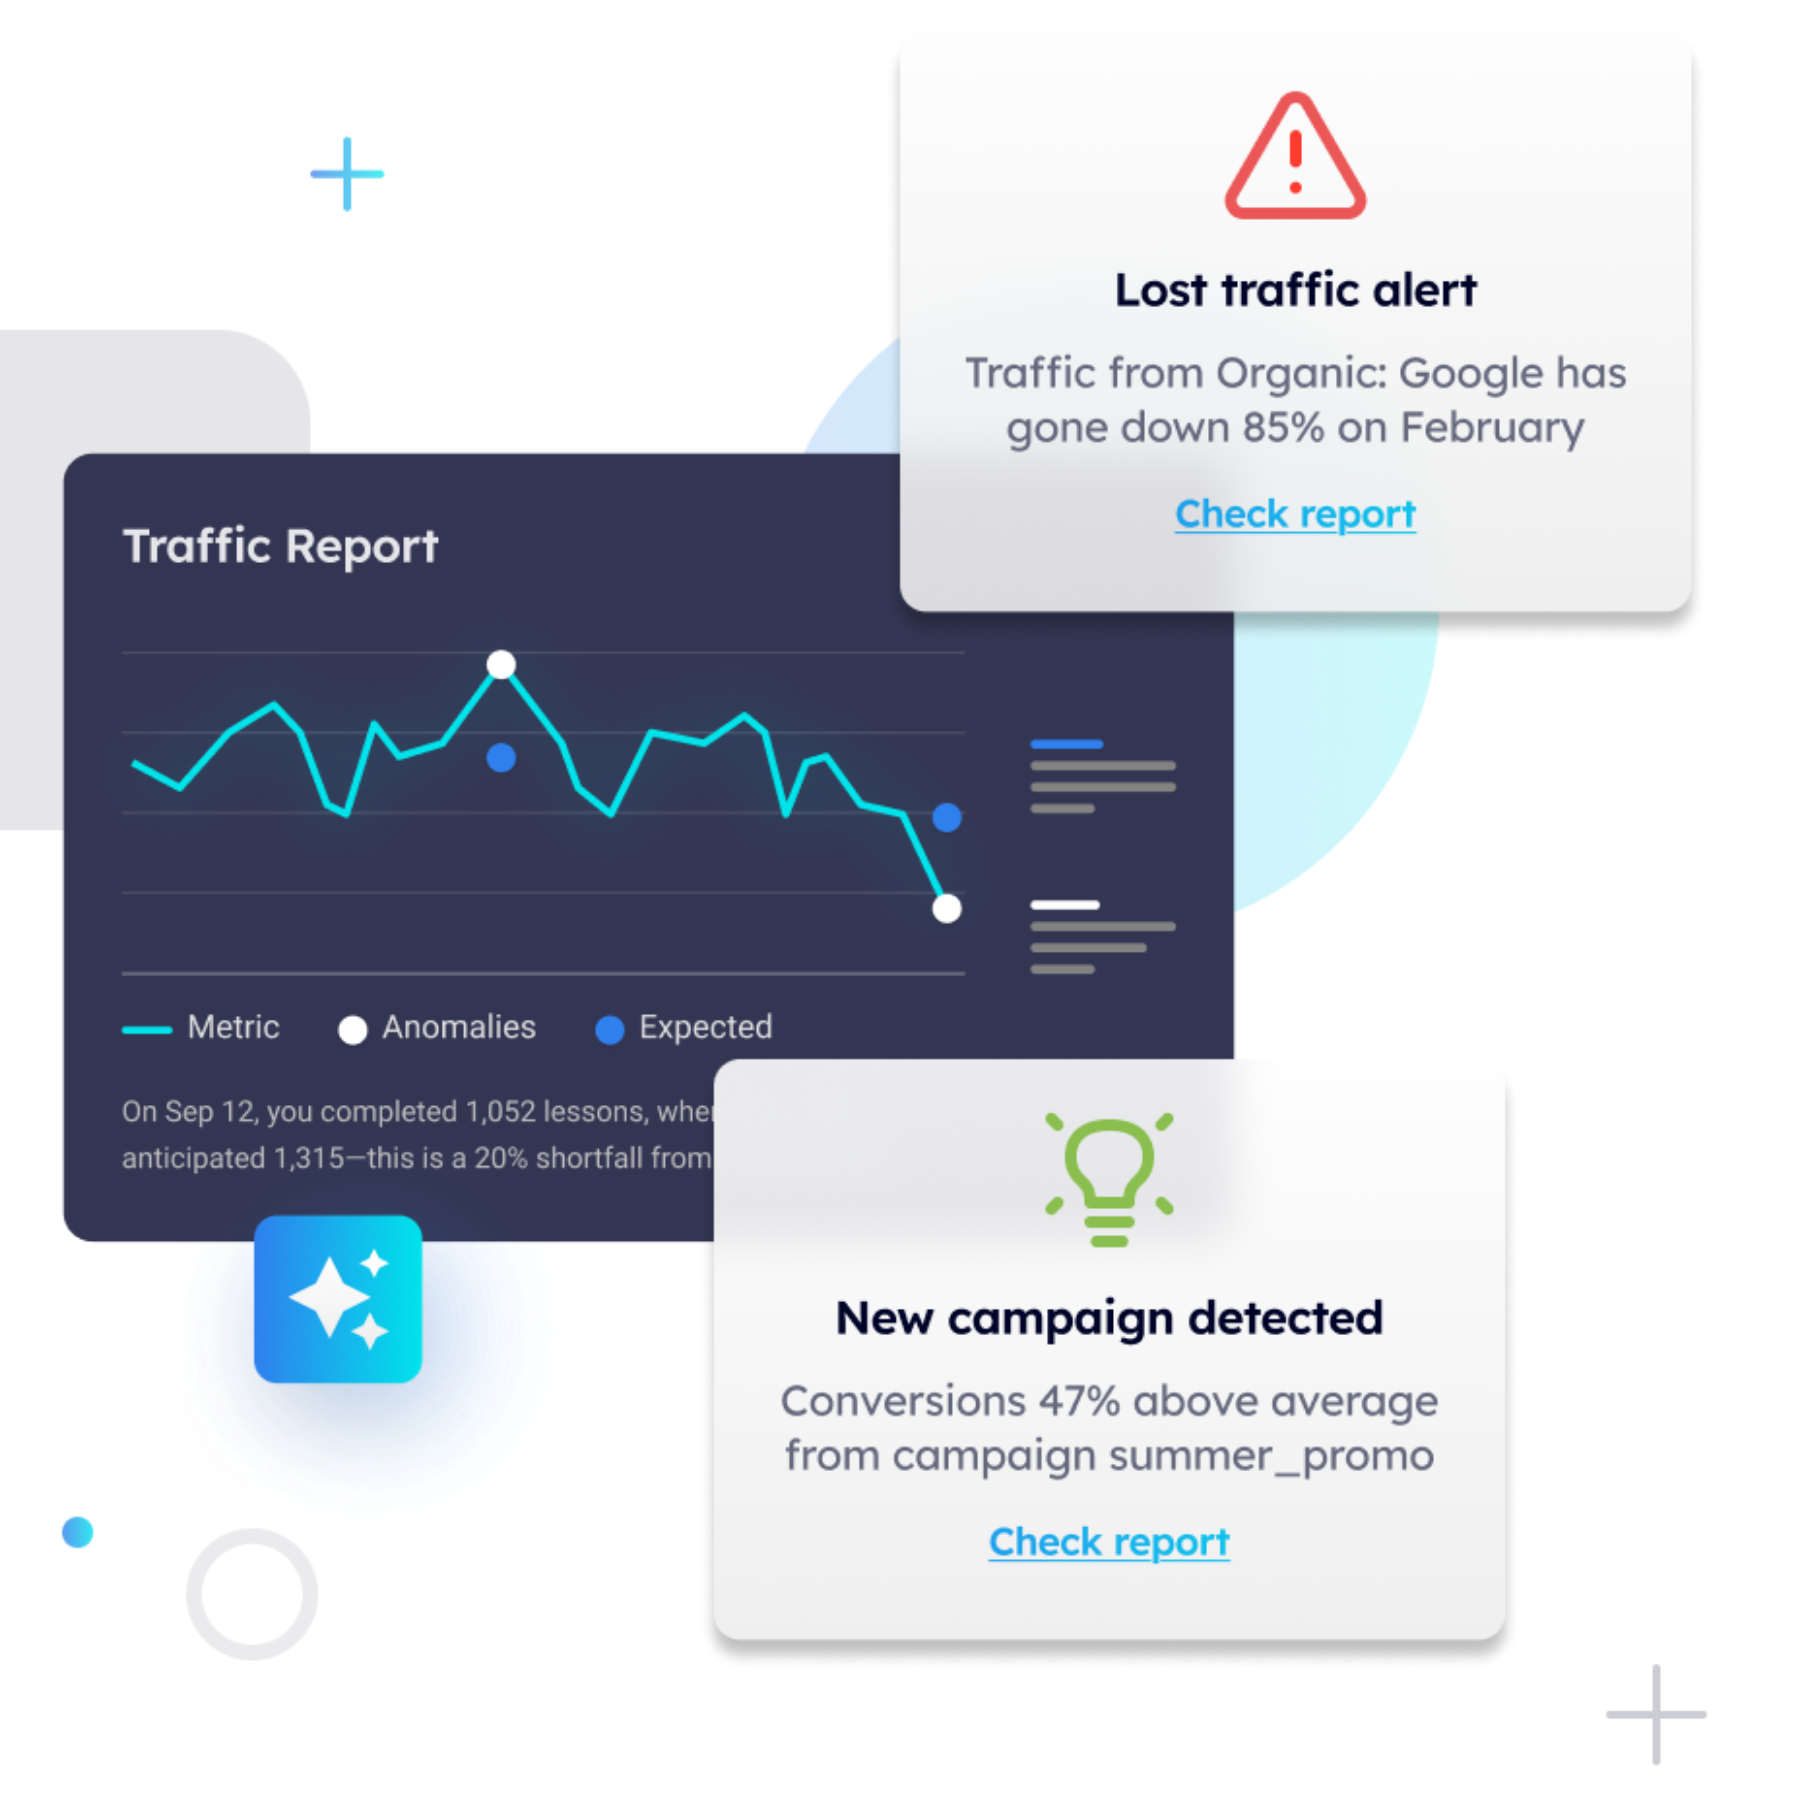
The mechanism is intent classification at the individual visitor level. As each session unfolds, Pathmonk reads behavioral signals in real time, including pages visited, scroll depth, time on each section, and interaction patterns, and assigns the visitor to one of three journey stages: Awareness, Consideration, or Decision. That classification updates continuously as the visitor moves through the site. The buying journey report makes the full stage distribution visible across your traffic so you can see immediately whether the drop is a composition problem (wrong-stage visitors arriving) or a persuasion problem (right-stage visitors not converting).
Once intent is classified, Pathmonk deploys microexperiences calibrated to each visitor’s current stage. These are small, targeted interactions that appear within the existing page without altering it: a value proposition surfaced at the right moment for a Consideration-stage visitor who has read the pricing page twice, a friction-reducing message for a Decision-stage visitor who keeps returning to the same product page without converting, a lower-commitment CTA for an Awareness-stage visitor who is not ready for a demo. The website underneath stays exactly as it is. The AI layer handles the gap between where each visitor is in their decision process and where your existing content leaves them.
Pathmonk runs a 50/50 A/B split between visitors receiving microexperiences and a control group receiving none. As the system accumulates data, it trains itself to weight the microexperiences and timing combinations that produce the highest conversion rate for each visitor segment. This means the response to a behavioral drop is not a one-time fix but a continuously improving intervention. The 20% uplift guarantee is tied to this model: if the AI cannot produce measurable improvement on the existing traffic volume, Pathmonk refunds the cost.
The practical implication for teams managing a confirmed drop is direct. The Diagnosis Stack tells you the drop is behavioral. The segmentation tells you which stage or segment it concentrates in. Pathmonk addresses that segment with intent-matched interventions while the rest of your roadmap continues on its normal timeline. You do not need to pause other work, wait for a redesign to ship, or run a test cycle before seeing results. Understanding how Pathmonk statistics work clarifies the measurement methodology: uplift is calculated against the control group, not against a historical baseline, which removes the attribution noise that makes most pre/post comparisons unreliable.
How Forrest Technical Paintings recovered from a persistent conversion drop without touching the website
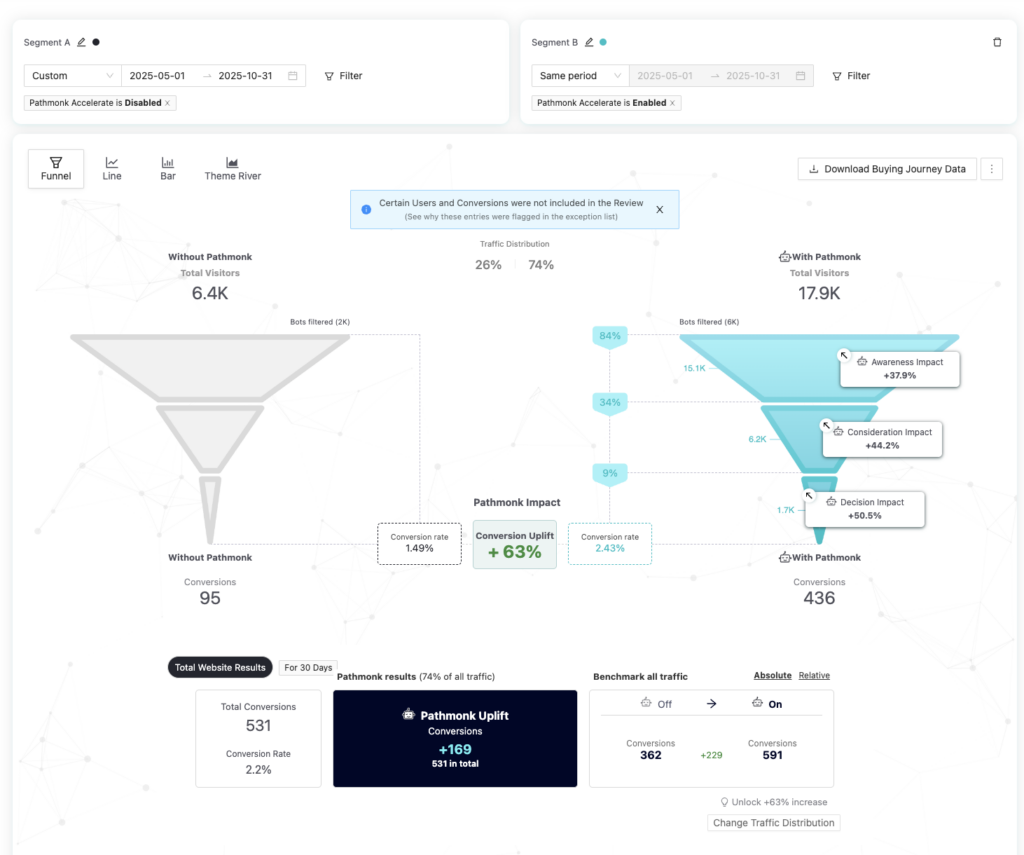
Forrest Technical Paintings manufactures high-performance industrial coatings for contractors and industrial buyers. Traffic was steady. The sales request form was converting at 1.49%. Standard analytics confirmed the problem but offered no explanation for it.
What made this case harder than usual: the website was outdated, no developer resources were available, and even minor changes took weeks. The entire standard CRO playbook was off the table.
Pathmonk’s intent classification identified a behavioral mismatch across all three funnel stages:
- Awareness visitors were leaving without enough context to confirm they were in the right place
- Consideration visitors were seeing no credibility signals — no certifications, no durability data, no proof suited to industrial buyers
- Decision visitors were reaching the form with no friction reduction before the ask
The site was not technically broken. It was silent at every moment that required a push.
Pathmonk deployed intent-matched microexperiences without modifying a single line of code. The conversion goal was identical for every visitor — submit a sales request. What changed was only the content bridging each visitor’s current stage to that goal.
Results across the first six months:
- +63% increase in conversion rate (1.49% → 2.43%)
- +169 incremental sales requests directly attributable to Pathmonk
- +303% increase in sales requests in the first week alone
- Measured against a clean 50/50 A/B control group — no baseline distortion
The lift was significant enough that the team scaled from 50% to 75% Pathmonk-enabled traffic within the first week. Everything happened without a redesign, without developer involvement, and without any change to the existing website.
FAQs on conversion rate drops
What sample size do I need before a conversion rate drop is statistically meaningful?
For a 4% baseline conversion rate, a 20% relative drop (to 3.2%) requires approximately 1,900 sessions in each period at 80% statistical power. For a 10% relative drop, you need roughly 7,600 sessions per period. Most landing pages do not generate this volume weekly, which is why daily or even weekly drops are almost never statistically actionable without extended measurement windows.
How long should a drop persist before I treat it as structural?
Three consecutive measurement periods at a consistent decline pattern is the practical threshold for most teams. One period is noise; two can be coincidence; three constitutes a trend. The exception is sharp technical drops (above 40% in a single period coinciding with a deployment), which should be investigated immediately regardless of persistence.
Can a traffic mix shift look exactly like a UX problem in the data?
Yes, reliably. If a paid campaign brings in a large volume of low-intent cold-audience traffic that inflates denominator sessions without proportionately increasing conversion events, the reported CR drops without any change in site behavior. Segment by acquisition channel before drawing any conclusions about on-site performance.
Does seasonal adjustment matter for conversion rate monitoring?
For most B2B SaaS, Q4 shows elevated conversion rates due to budget-flush purchasing, and July/August shows the sharpest declines due to reduced organizational buying activity. Year-over-year comparisons are more reliable than month-over-month for detecting genuine trends. A drop from November to January tells you nothing about the site.
How do you distinguish a technical breakage from a behavioral drop in the first 48 hours?
Check form submission events against CRM or backend records within 6 hours of noticing the drop. A gap greater than 10% between front-end conversion events and back-end records almost certainly indicates a technical failure. If the records match but both are down, the drop is behavioral.
Should I investigate a drop if the absolute volume of conversions is stable?
If total conversion volume is flat but session volume has increased substantially, the CR drop is real but may indicate traffic quality degradation rather than a persuasion failure. Investigate traffic source and audience composition first, since adding low-intent traffic to a fixed-capacity funnel naturally dilutes CR without any change in the site’s persuasion capability.
What is the risk of over-investigating conversion drops?
Each false investigation cycles developer, analyst, and CRO time away from genuine optimization work. Teams that investigate every rate movement below 95% confidence thresholds typically spend 60-70% of their CRO budget on noise, which makes it considerably harder to justify CRO investment internally. Establishing written investigation criteria, minimum drop magnitude, minimum persistence, minimum statistical confidence, before a drop occurs removes the emotional response from the decision.
Does A/B testing affect how you diagnose conversion drops?
A live A/B test complicates anomaly detection significantly. If the test is allocating 50% of traffic to a variant, the effective sample for each group is halved, doubling the natural variance. Reported site-level CR during an active test is not directly comparable to pre-test baselines. Segment all diagnostic analysis by test group to avoid conflating test variance with genuine behavioral shifts. A structured approach to CRO testing and experimentation includes pre-defined rules for exactly this scenario.
Translate all your data into clear insights
Discover how to future-proof your marketing data strategy with AI-powered analytics.
Free download
Key takeaways
- A conversion rate drop is noise if it falls within ±2 standard deviations of the trailing mean for that traffic volume. Calculate this before investigating.
- Four causes produce real drops: traffic composition shifts, technical breakage, behavioral change, and external market shifts. Each requires a different response.
- The Diagnosis Stack sequences investigation from cheapest (statistical check) to most expensive (market analysis), eliminating each category before escalating.
- The most reliable signal of a real behavioral problem is concentration: the drop manifests in one specific segment, funnel stage, or device/channel combination rather than distributing uniformly.
- Segment by source, device, funnel stage, and visitor type before forming any hypothesis about on-site problems.
- Technical breakage and behavioral change often look identical in aggregate metrics. The discriminating test is front-end event count vs. back-end record count.
- Standard analytics are retrospective; intent classification tools identify behavioral shifts 2-3 weeks before they aggregate into statistically significant CR drops.
- Seasonal and attribution-timing factors systematically distort B2B SaaS conversion metrics. Year-over-year cohort comparisons outperform period-over-period for genuine trend detection.
- A continuous A/B control group functions as a real-time behavioral baseline that surfaces drops earlier and more precisely than aggregate dashboards.
- Written investigation criteria set before a drop occurs are more reliable than ad hoc judgment after one. Define the minimum conditions that justify an investigation and enforce them consistently.